The gender voting gap in New Zealand: why 2023 was different
The recent rise of the radical right in countries around the world has highlighted a long-standing gender gap in voting preferences. Radical right parties such as Reform UK and Alternative for Germany (AfD) typically draw a much higher percentage of their support from men than women. At the other end of the political spectrum, Green parties usually do better with women than men.
Politics in New Zealand is its own beast, however. The Green party has been a part of the NZ system for many decades, but — as yet — no party in parliament has consistently taken on positions that could be called “radical right”. Moreover, the centrist parties (Labour and National) have won the lion’s share of the vote throughout most of the MMP era. Gender voting patterns in NZ may therefore be different from other countries.
What does the data tell us about the gender gap in NZ? The short answer, drawing on data from the New Zealand Election Study (NZES), is that there is a gap — women tend to lean to the left of men, and that has held across most of the past three decades. But it’s a small enough gap that it can be overwhelmed by other factors in any given election — 2023, being a clear case in point.
The gender gap in 2023
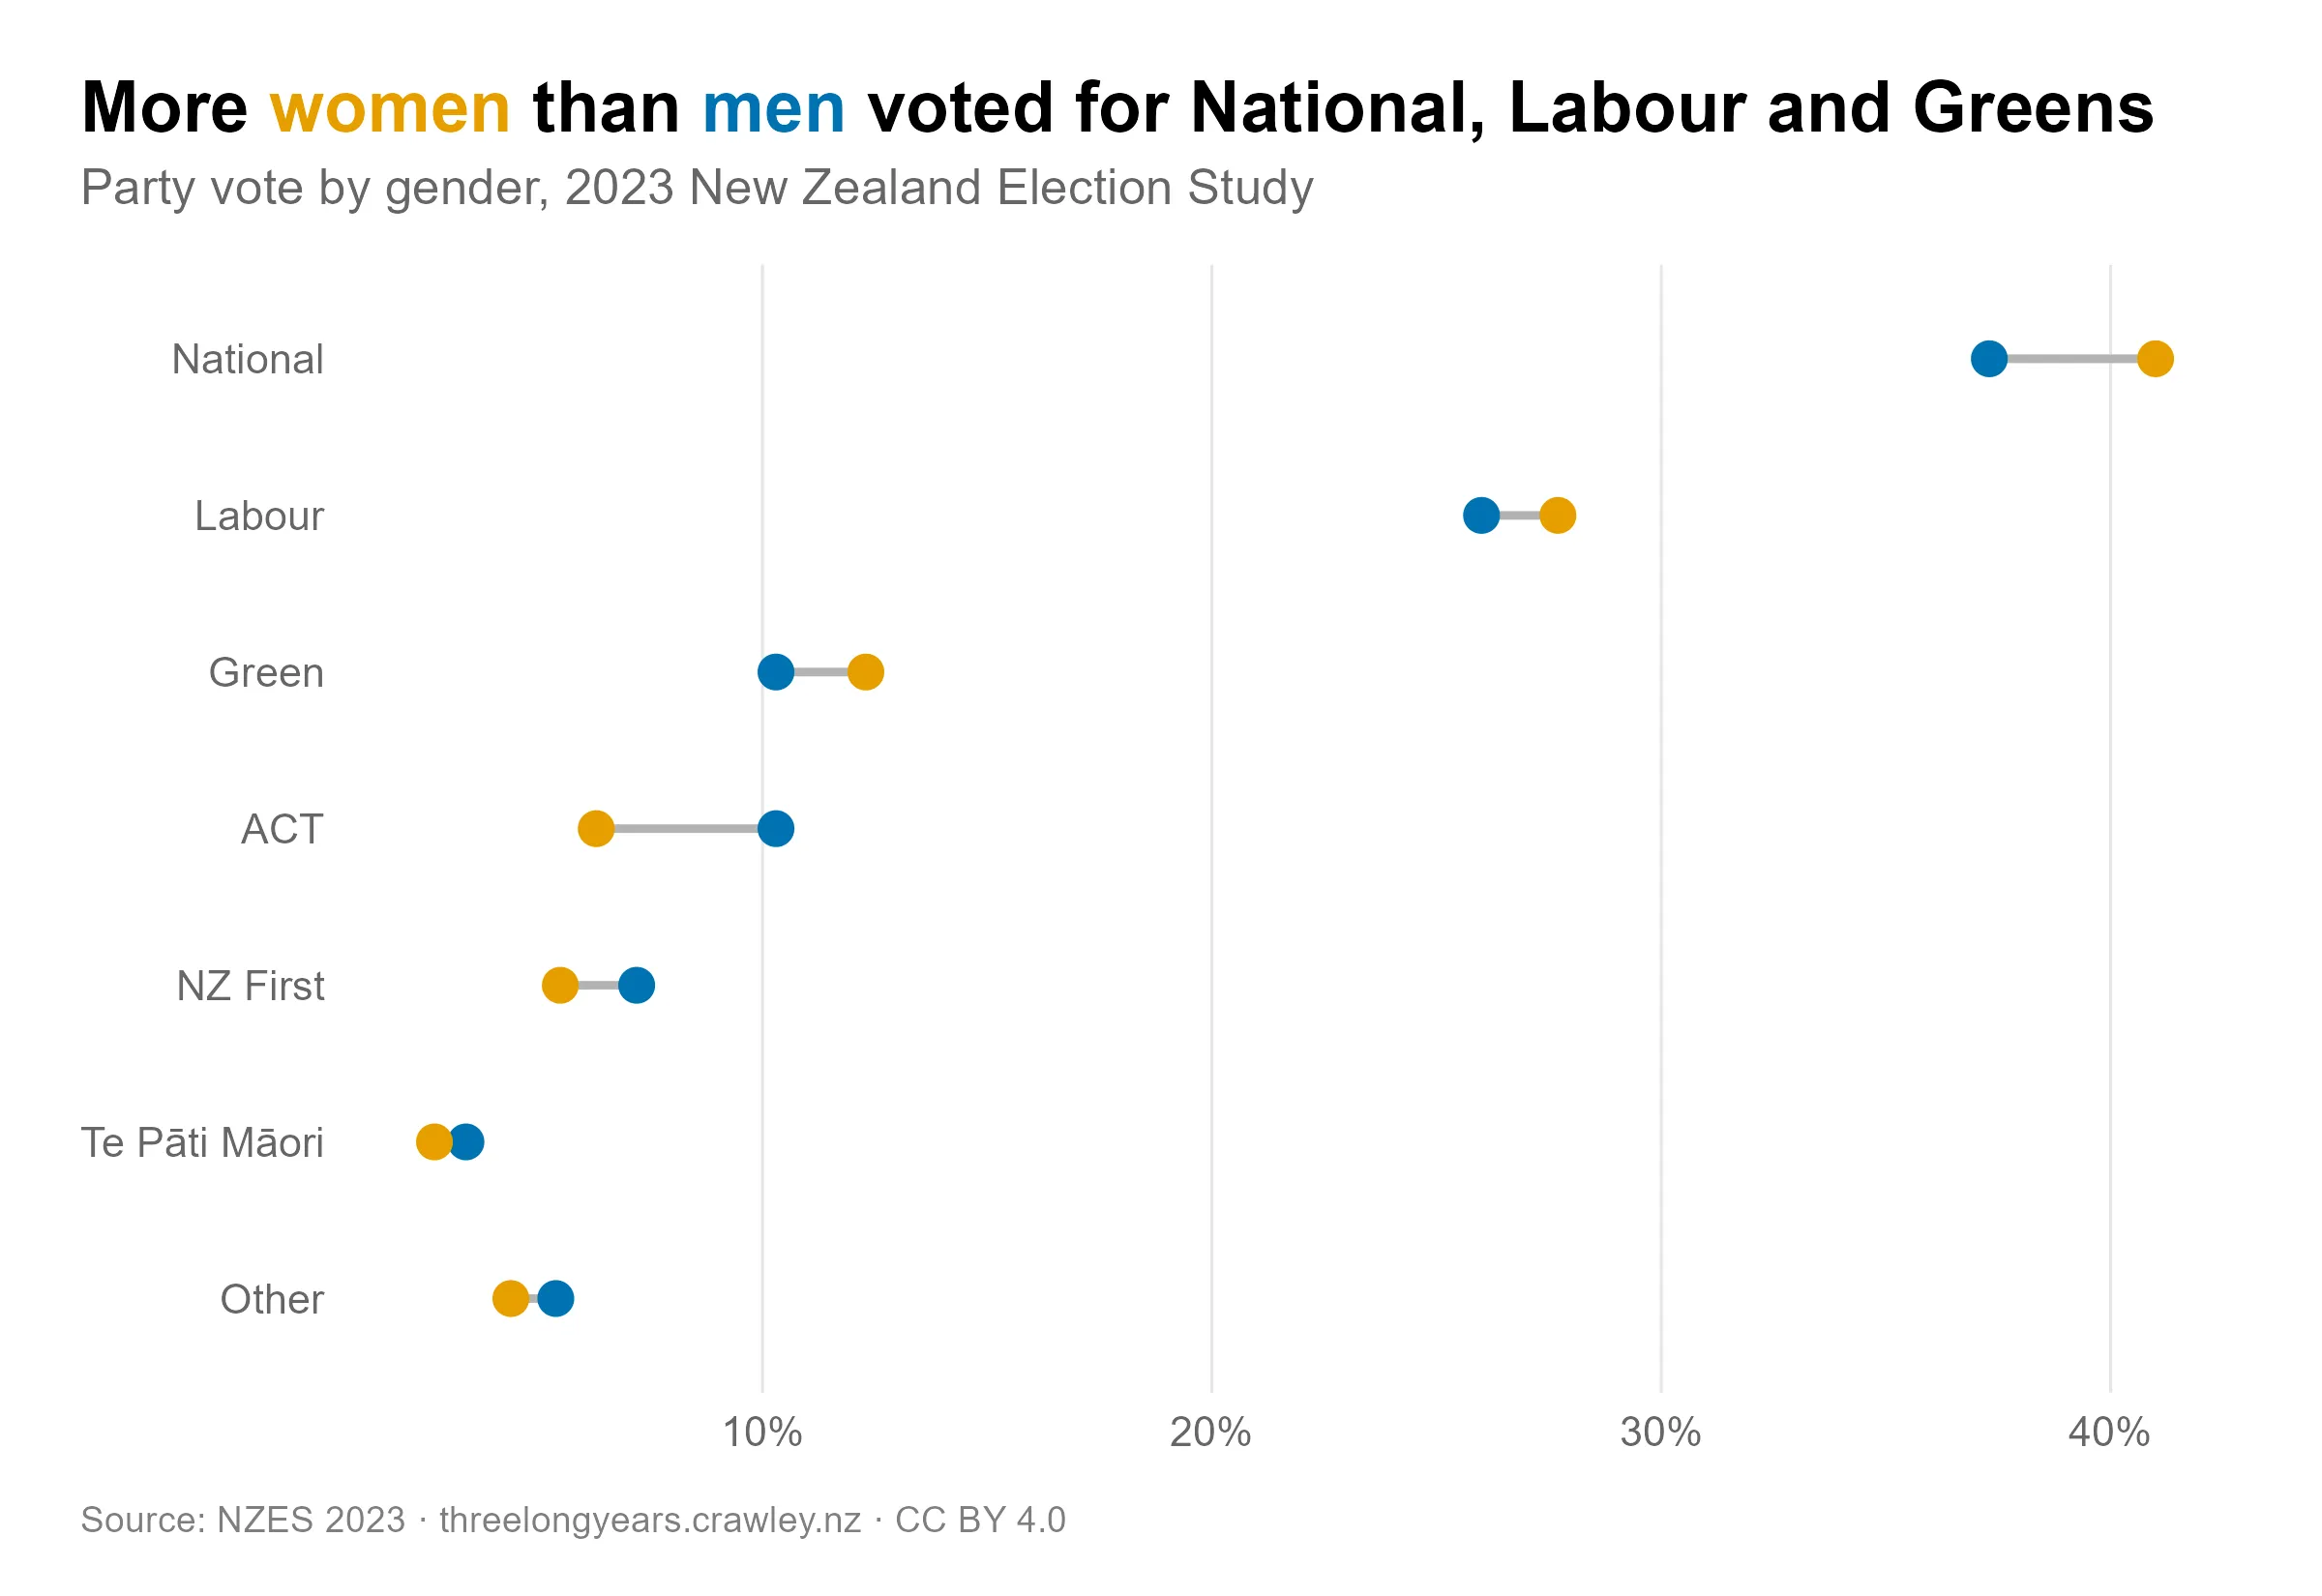
In the 1960s, poet James K. Baxter wrote about having a “National mum and Labour dad” — and most would now expect the reverse. But as the graph below shows, National actually won a higher share of women voters than men in 2023 — 41% vs 37%. Labour also drew slightly more women than men, but by a smaller margin.
Party vote by gender, 2023 (including missing responses)
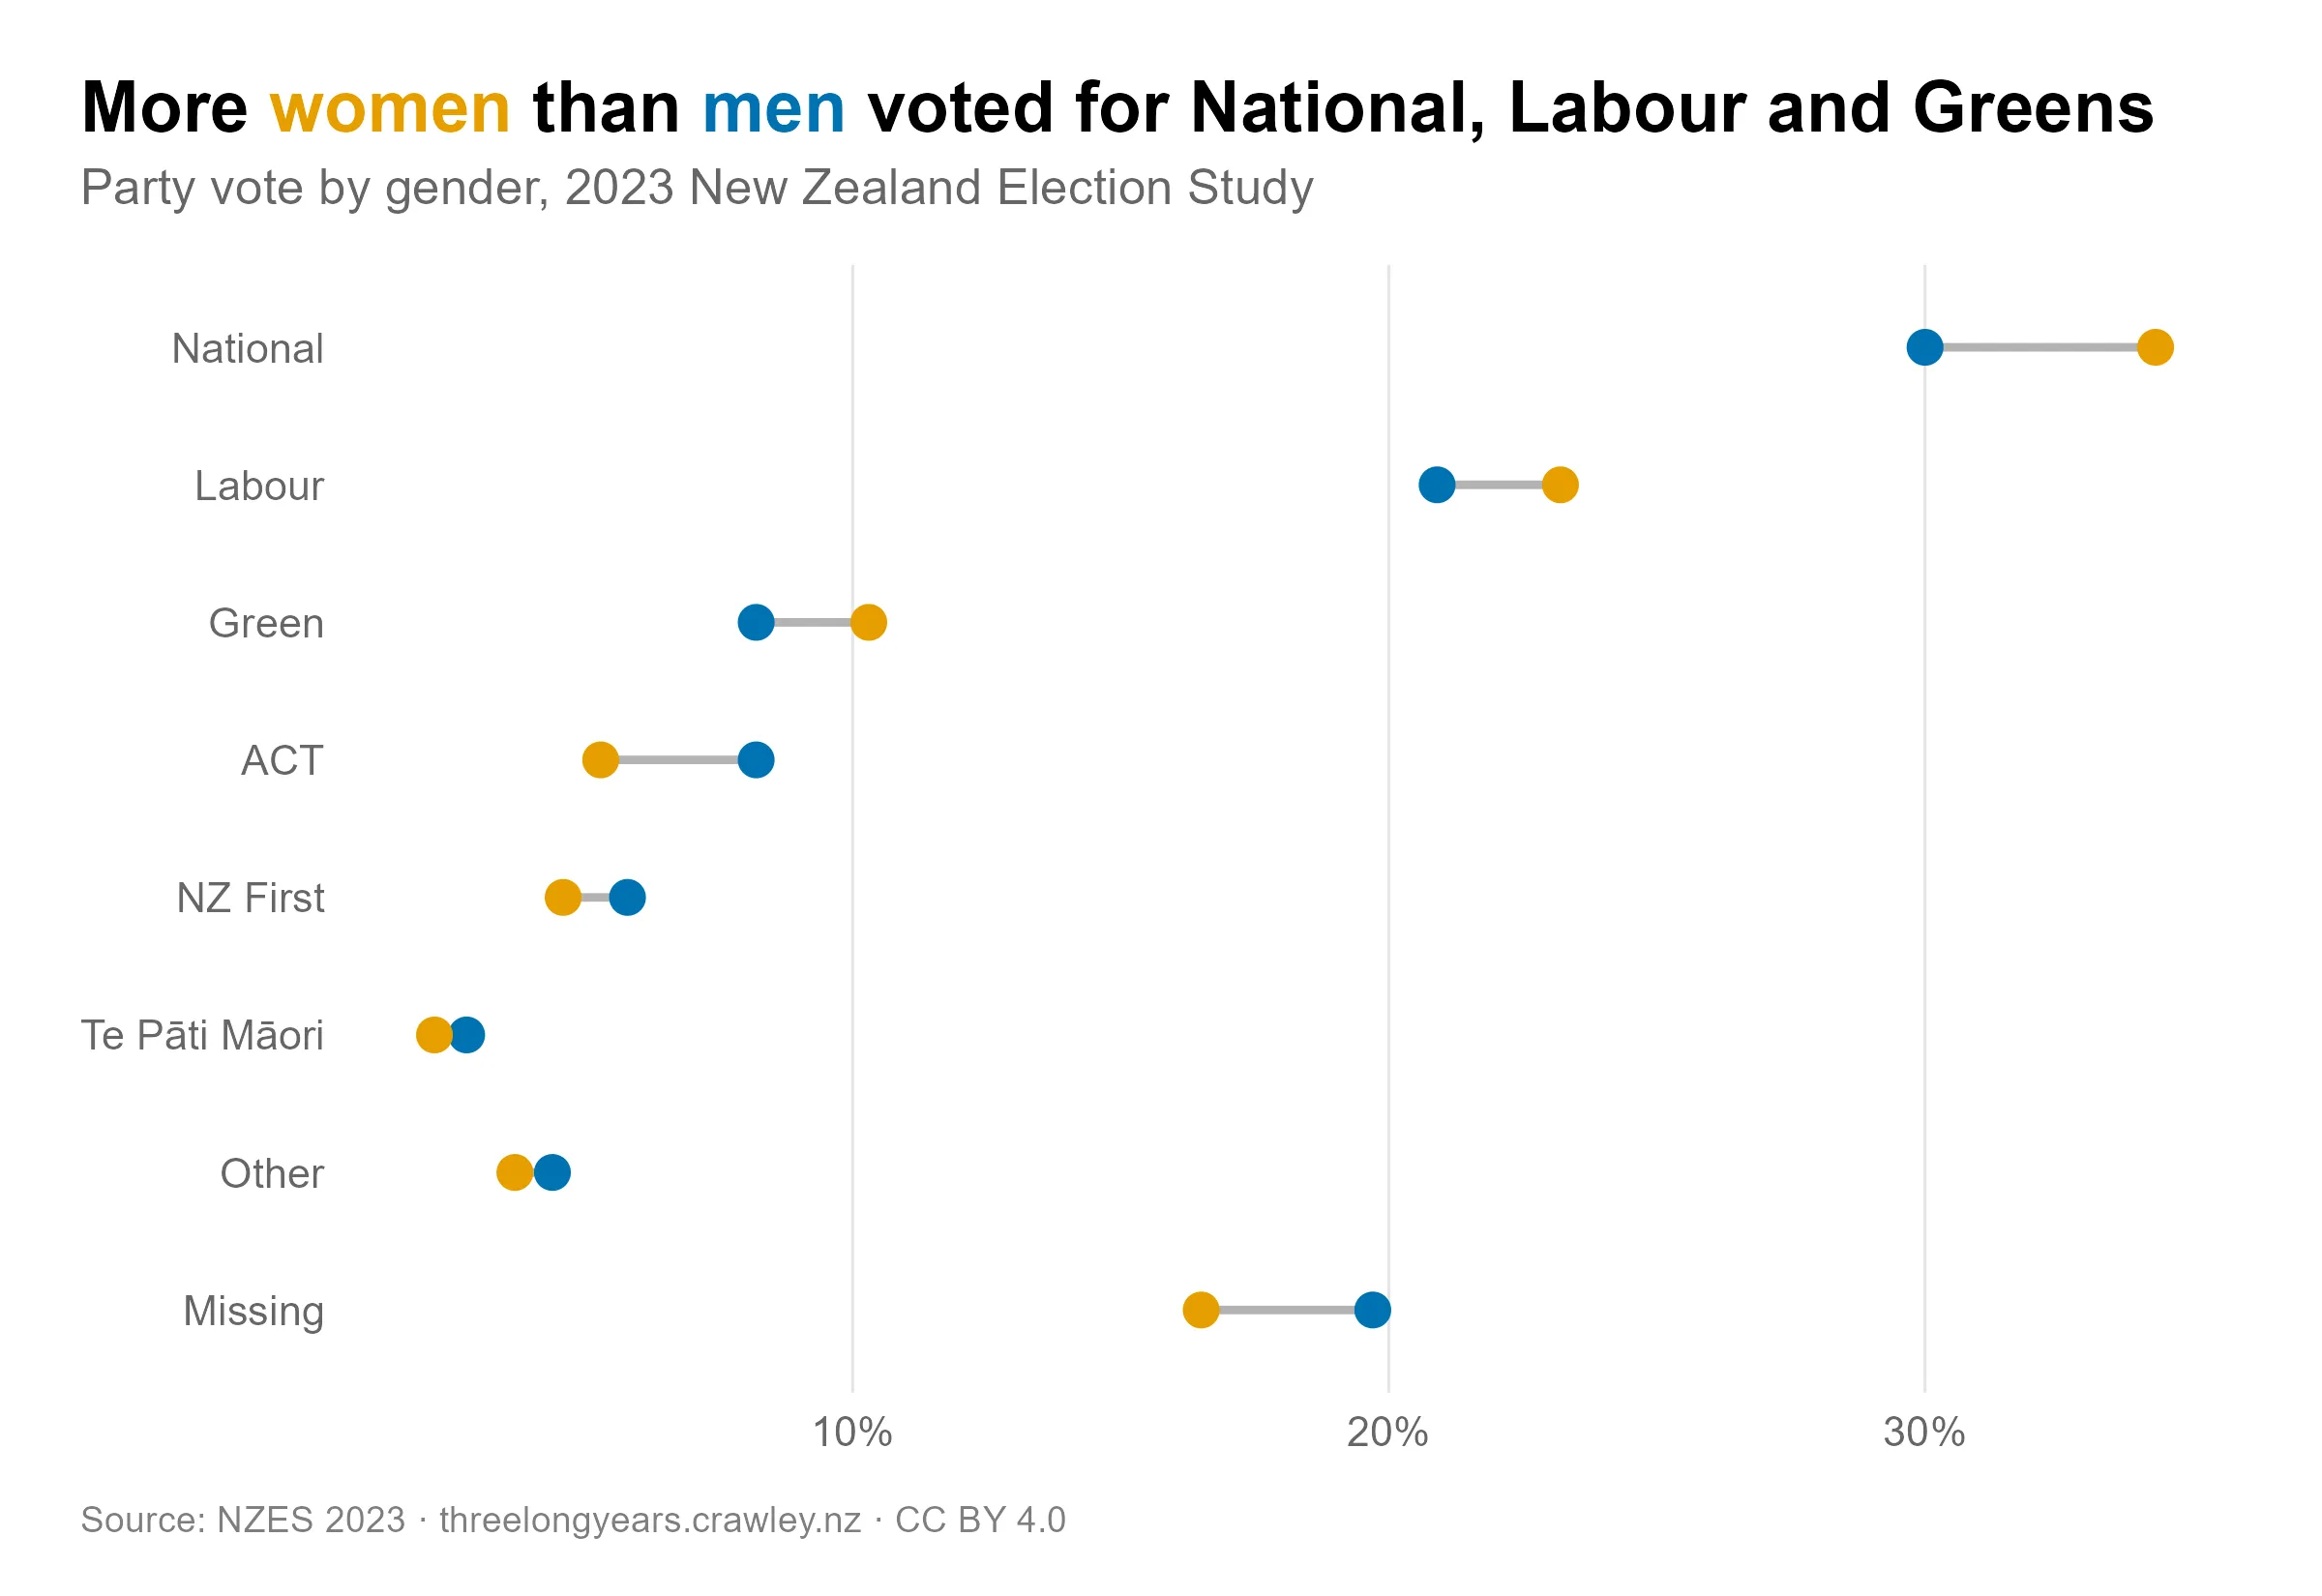
One possible explanation is that voters saw National as the most credible on cost of living. This could have meant National attracted more women than men — reasearch from Australia shows women tend to care more about the cost of living than men.
As for the other parties in 2023, they all had gaps going in the direction we might expect: the Green party drew more of its support from women than men, while the NZ First and ACT gaps were the reverse.
Gender voting gap trends
Was 2023 a typical result with respect to the gender voting gap? I analysed NZES data going back to 1996 to find the trends.
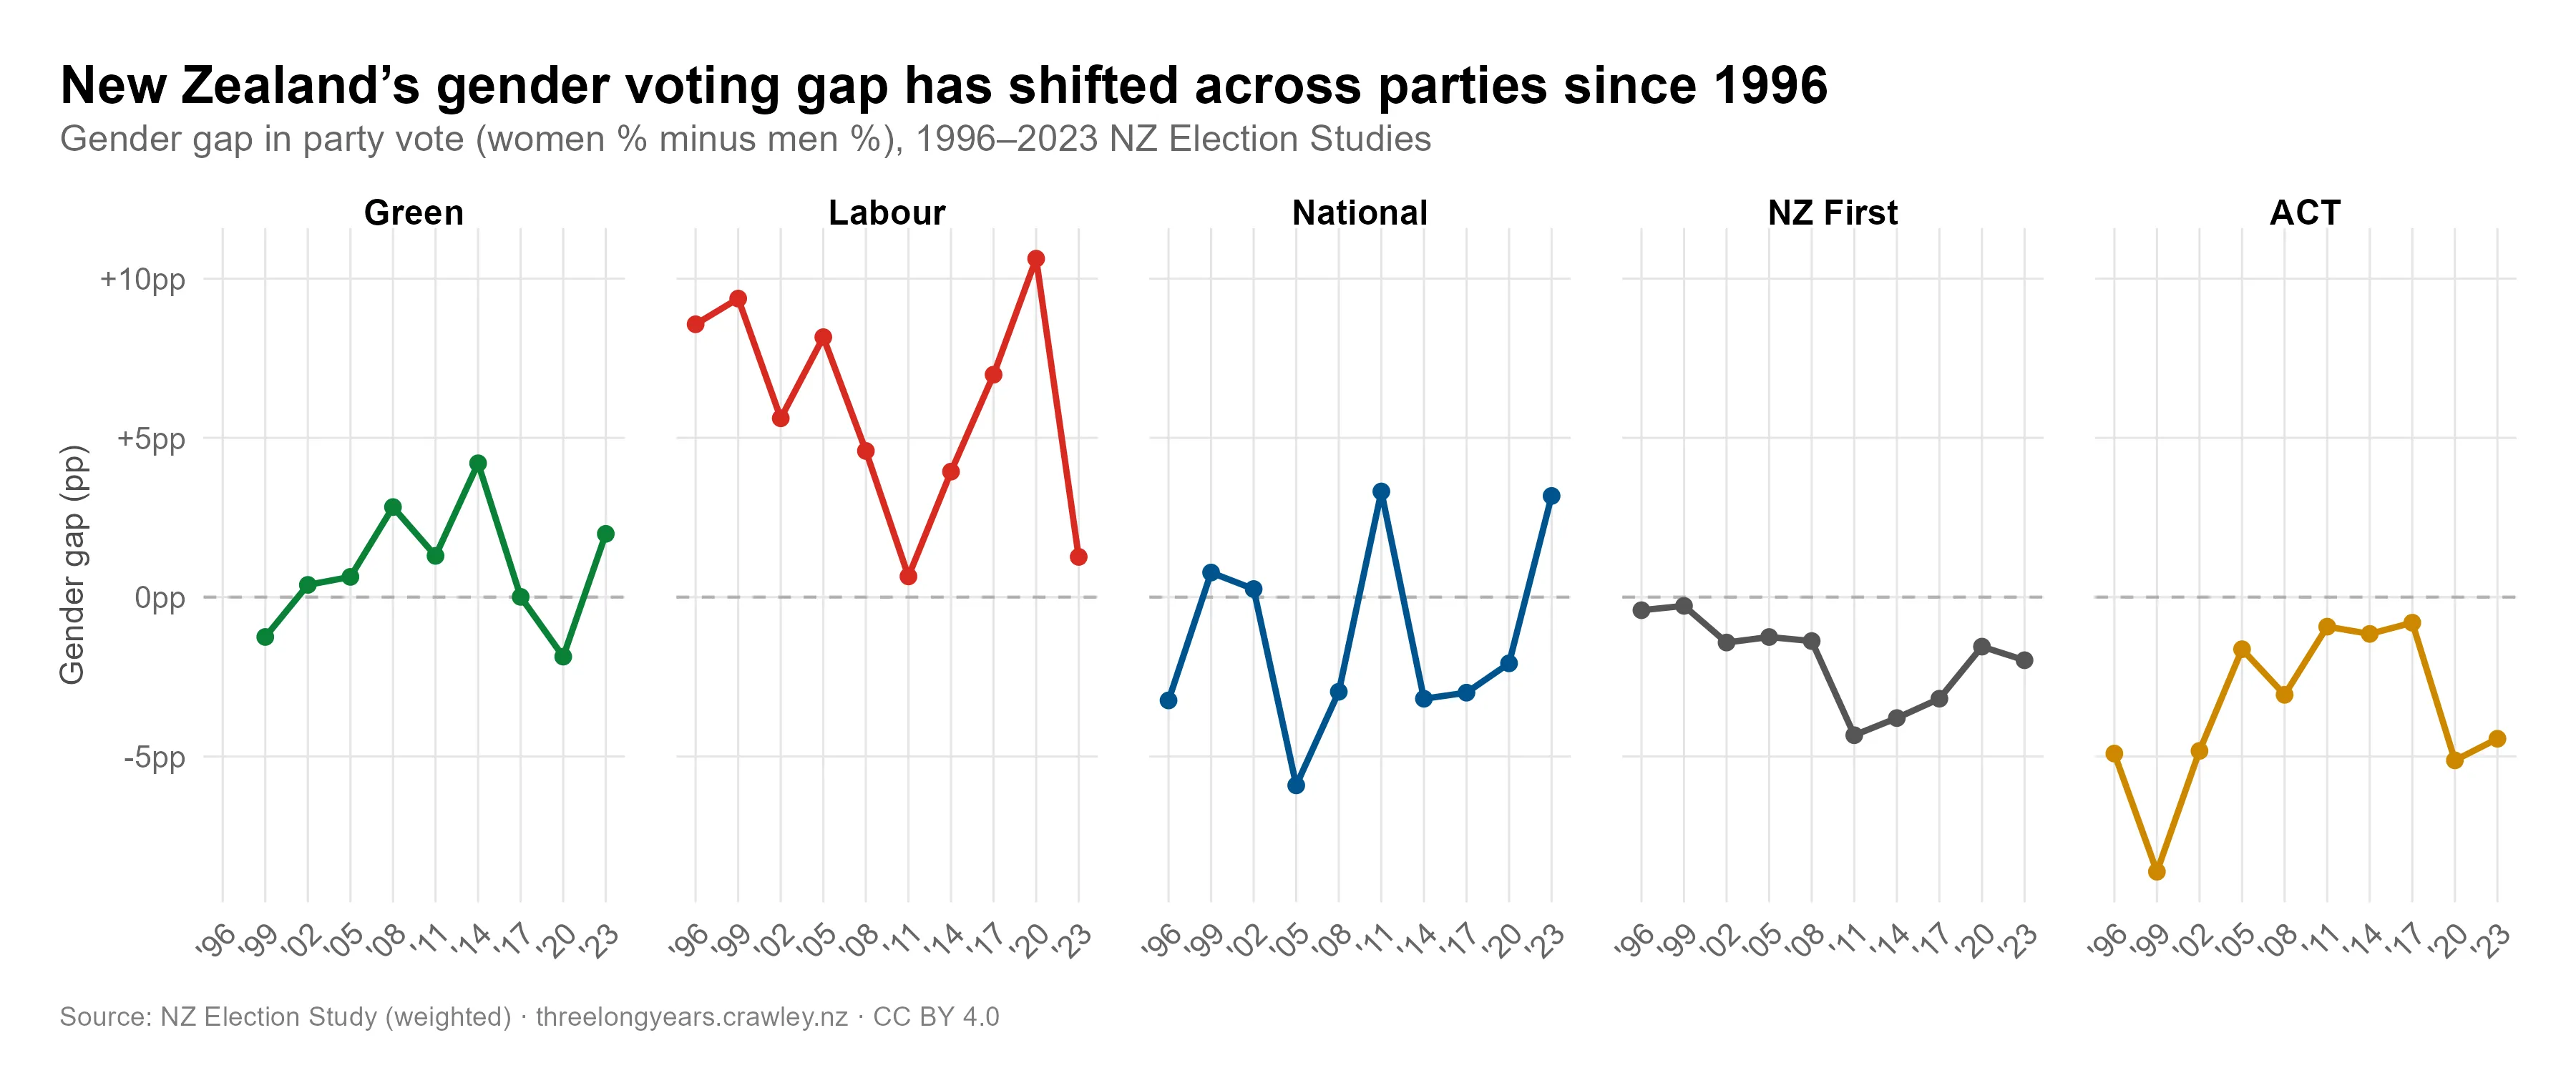
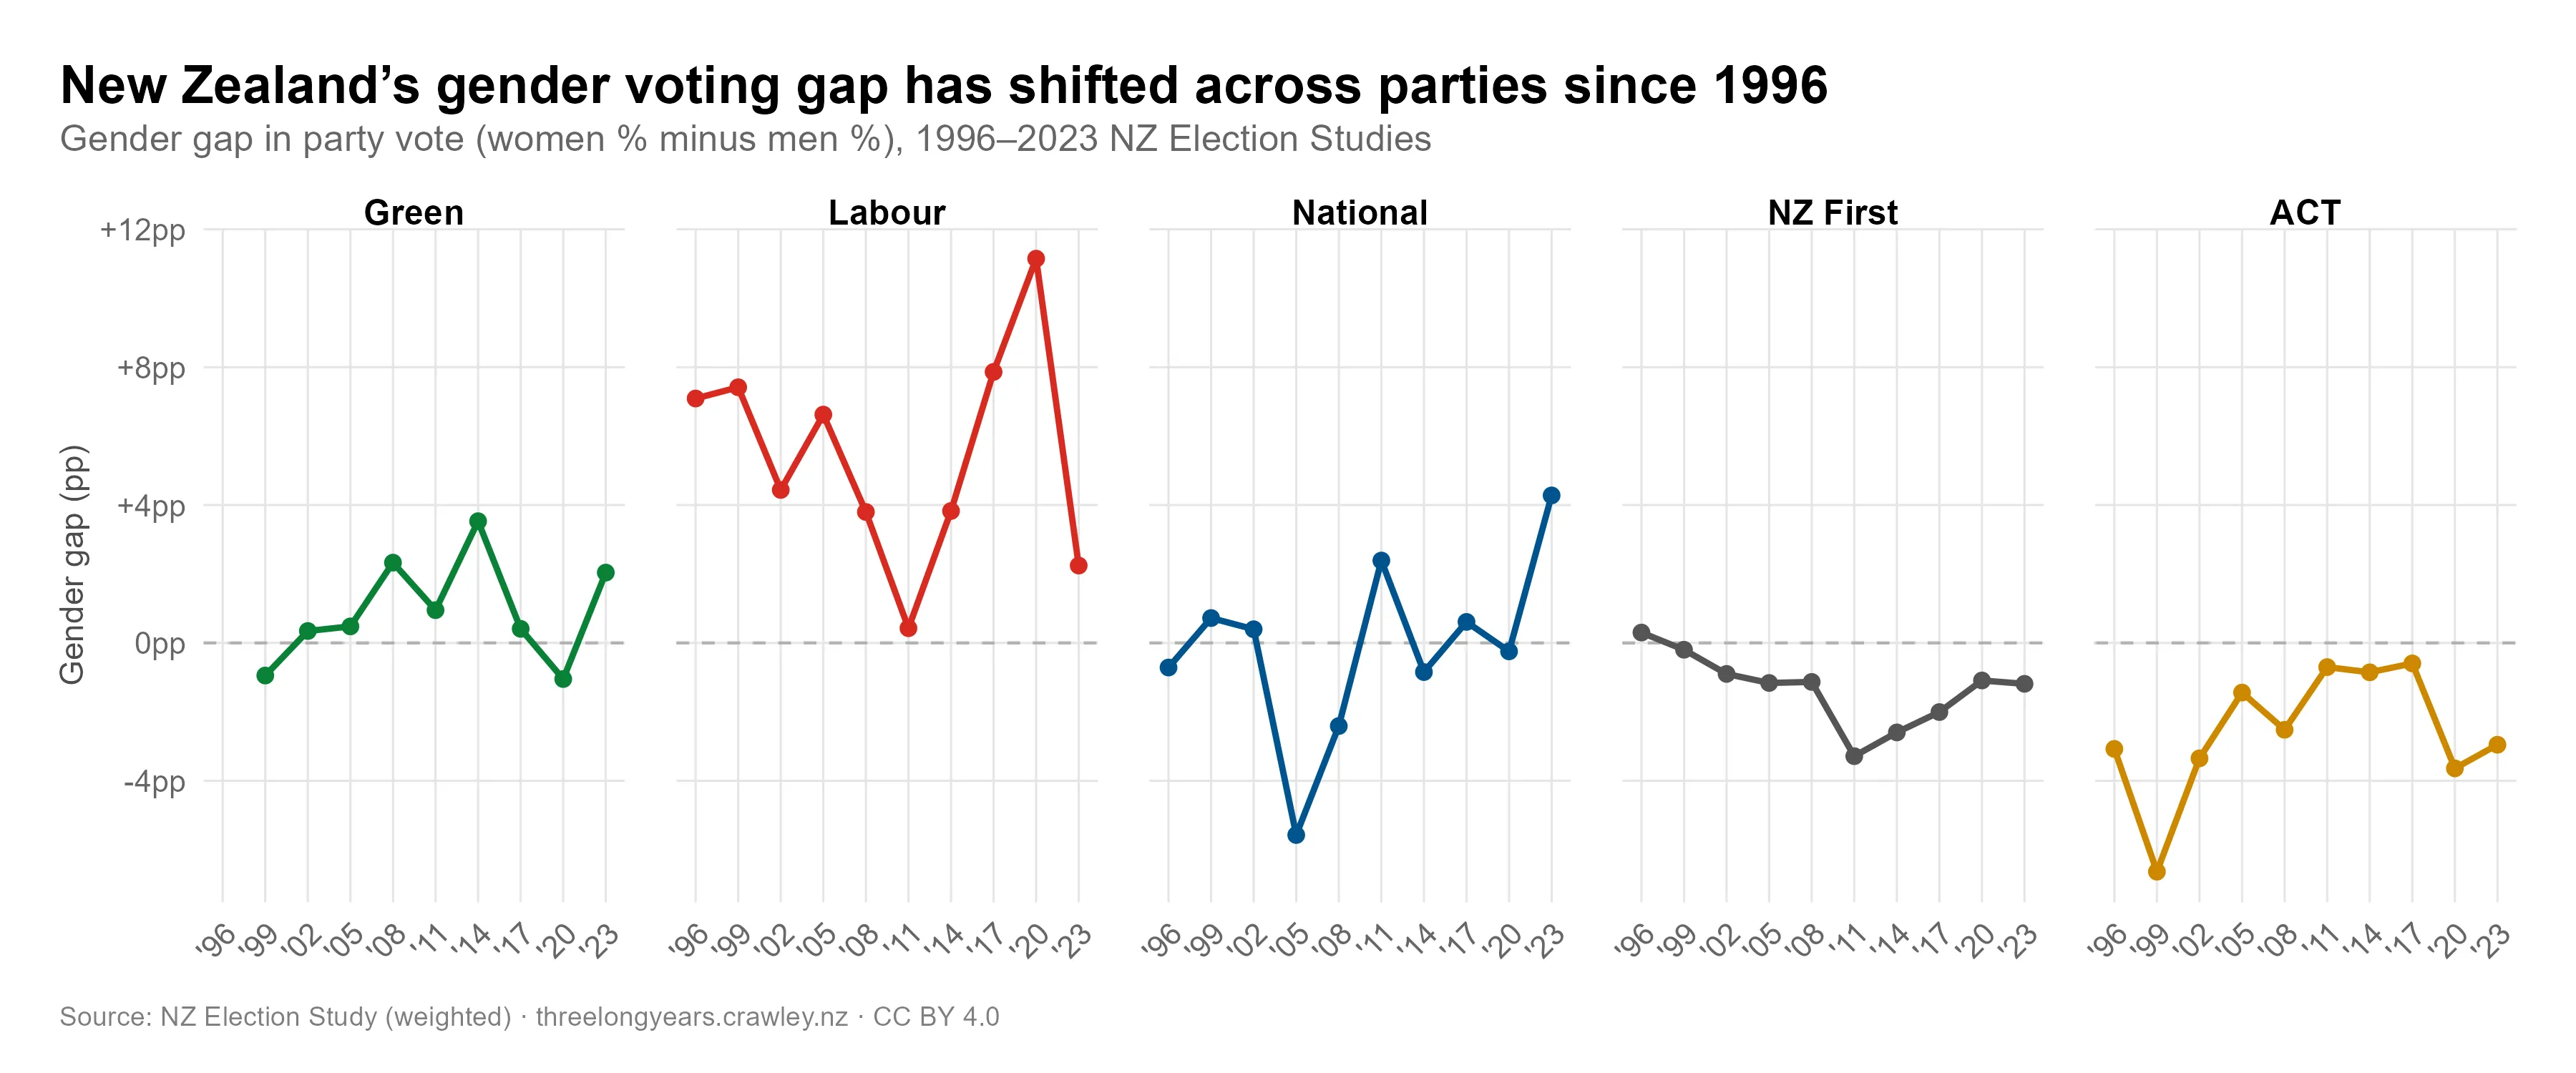
2023 was actually something of an outlier for National: it is one of the few elections where women voters significantly tilted toward them rather than away, the other example being 2011. Labour’s two smallest gaps correspond to these years (2011 and 2023) — when National gains among women, Labour tends to lose them.
These swings between Labour and National ripple through to the Greens as well. Labour attracted such a high share of women voters in 2020 that — contrary to the usual pattern — the Green party had more men than women voters. NZ First and ACT always attract a higher share of men than women.1
Gender voting gap by party (with missing), 1996–2023
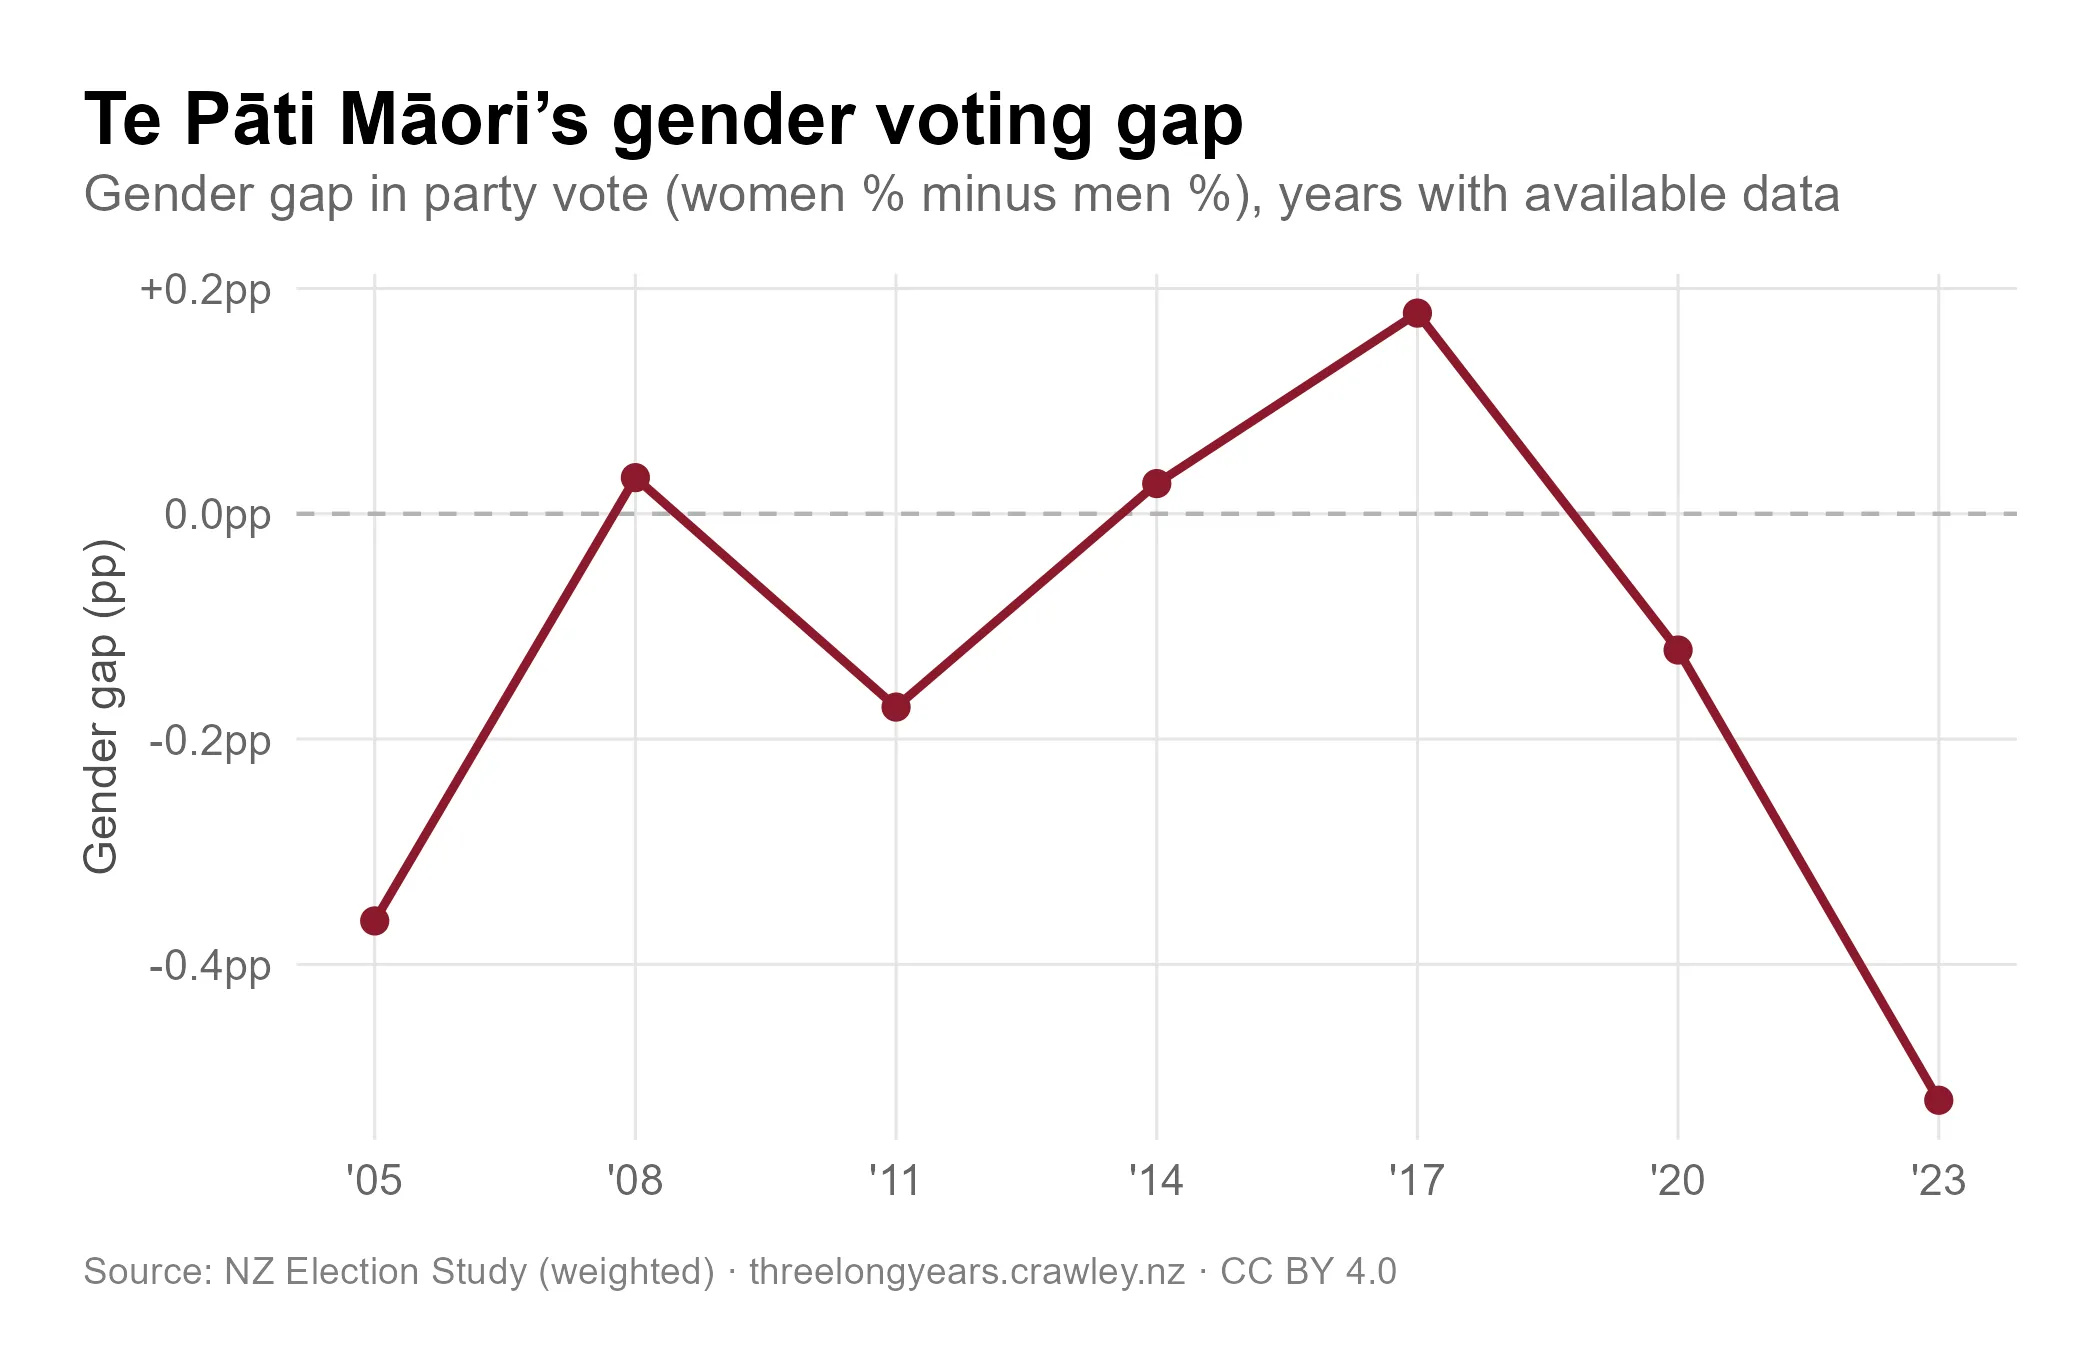
Te Pāti Māori gender voting gap, 2005–2023
Political orientation and gender
While people’s party vote can shift election to election, their political orientation tends to be more stable — which makes it a better test of whether the gender gap reflects a genuine ideological divide. The figure below shows the difference in the average of where men and women place themselves on the left-right political spectrum.
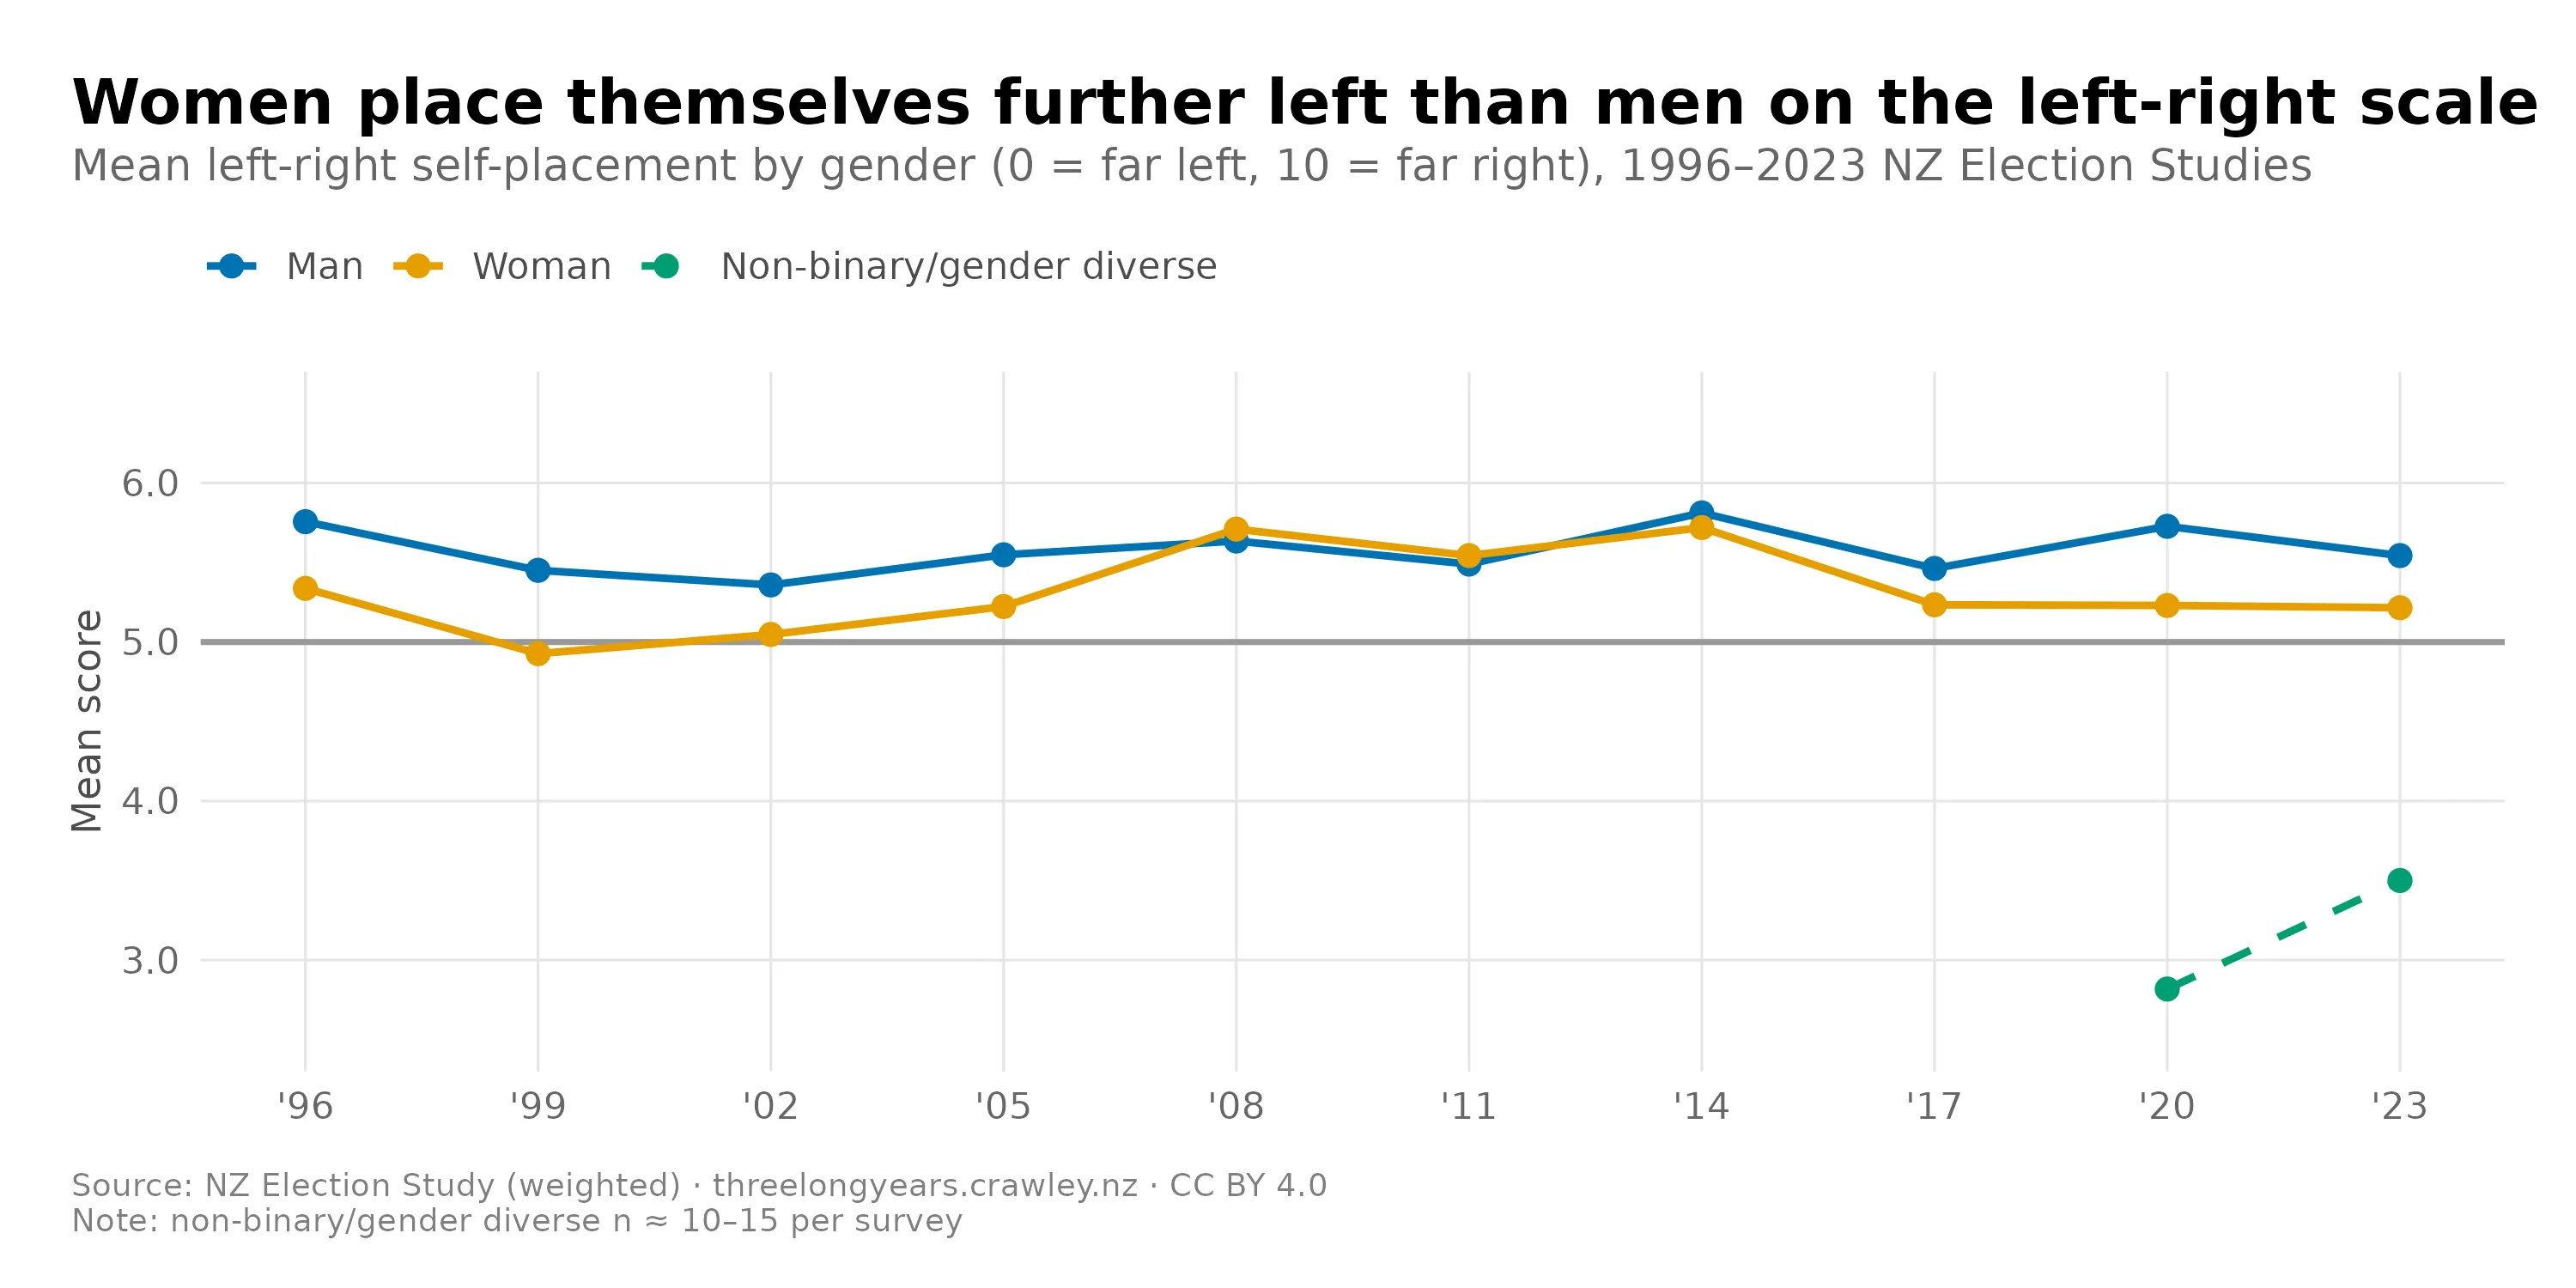
Men are generally further right than women, although the gap is small, less than half a point on the scale (where 0 is far left and 10 is far right) in each year. The pattern is stable as well. Apart from a period during the John Key years when women became more right-leaning, the gap has remained the same over time.
In recent years, NZES has added a “gender diverse” option to the gender question. Only a very small number of respondents identify as gender diverse. Their average left-right placement is substantially further left than both men and women — consistent with international research finding that gender-diverse people lean markedly further left than the broader population. However, the sample size is far too small to draw firm conclusions.
The significance of the gender gap
National and Labour campaign strategists are well aware of these patterns. Labour’s weakest results — 2011, 2014, and 2023, all below 30% — coincided with some of their smallest gender gaps. While National has often prospered regardless of the direction of their gender gap, they will be keen to retain as many of the women voters they won in 2023 as possible. Expect both parties to run 2026 campaigns with women in mind.
Of course, these are generalisations — there is substantial variation in voting preferences and ideology of both men and women. There are no definitive lists of “women’s issues” (or “men’s issues”), and different parties will approach gender differences in different ways.
That said, the broad pattern is clear: as in other countries, women in New Zealand tend to lean to the left of men, and that has held across most of the past three decades of NZES data. The gap is real. But it is also small — small enough that it can be overwhelmed in any given election, as it was in 2023, when National won women voters to cut across the usual patterns. The gendered polarisation reported elsewhere doesn’t have a clear analogue here. In NZ, the two centrist parties are competing for many of the same women voters, and 2023 showed how decisively that competition can swing.
Footnotes
-
I’ve included Te Pāti Māori in a separate figure, due to the shorter time frame and smaller sample size in most elections. All the numbers for the smaller parties should be treated with caution due to small sample size. ↩
The analysis code for this post is available on Codeberg.
View code on Codeberg →