Immigration has rarely driven NZ elections. Could 2026 buck the trend?

Immigration has been a hot political issue in Aotearoa over the last few weeks. NZ First deputy leader Shane Jones claimed (incorrectly) that the recently signed free trade agreement with India would lead to a tsunami of unfettered immigration. The ACT party adopted policies to make it harder to enter NZ as an immigrant, while Internal Affairs Minister (and ACT MP) Brooke van Velden announced a new citizenship test. PM Christopher Luxon also discussed immigration at length in yesterday’s pre-budget speech.
Fears about immigration have fuelled the rise of populist radical right parties across Europe, Australia and the US. NZ politics has not followed suit to the same degree. NZ First has at times occupied similar ground to the radical right in other countries, but at other times has been more centrist. And while immigration sometimes features on the political agenda here, debates usually haven’t had the same intensity.
In this post, which is the first of two parts, I analyse data from the NZ Election Study (NZES) to understand what kiwis think about immigration, how that has changed over time, and how attitudes differ by party support. If immigration debates in NZ are becoming more intense, how does this moment fit into the wider historical context?
In the second post next week, I will examine what kind of issue immigration is in Aotearoa. Is it more about economics or culture?
Overall perceptions of immigration
The main NZES question about immigration asks people whether they think the number of immigrants allowed into New Zealand should be reduced or increased. It has been asked in every election year, going back to 1996, as shown in the figure below.
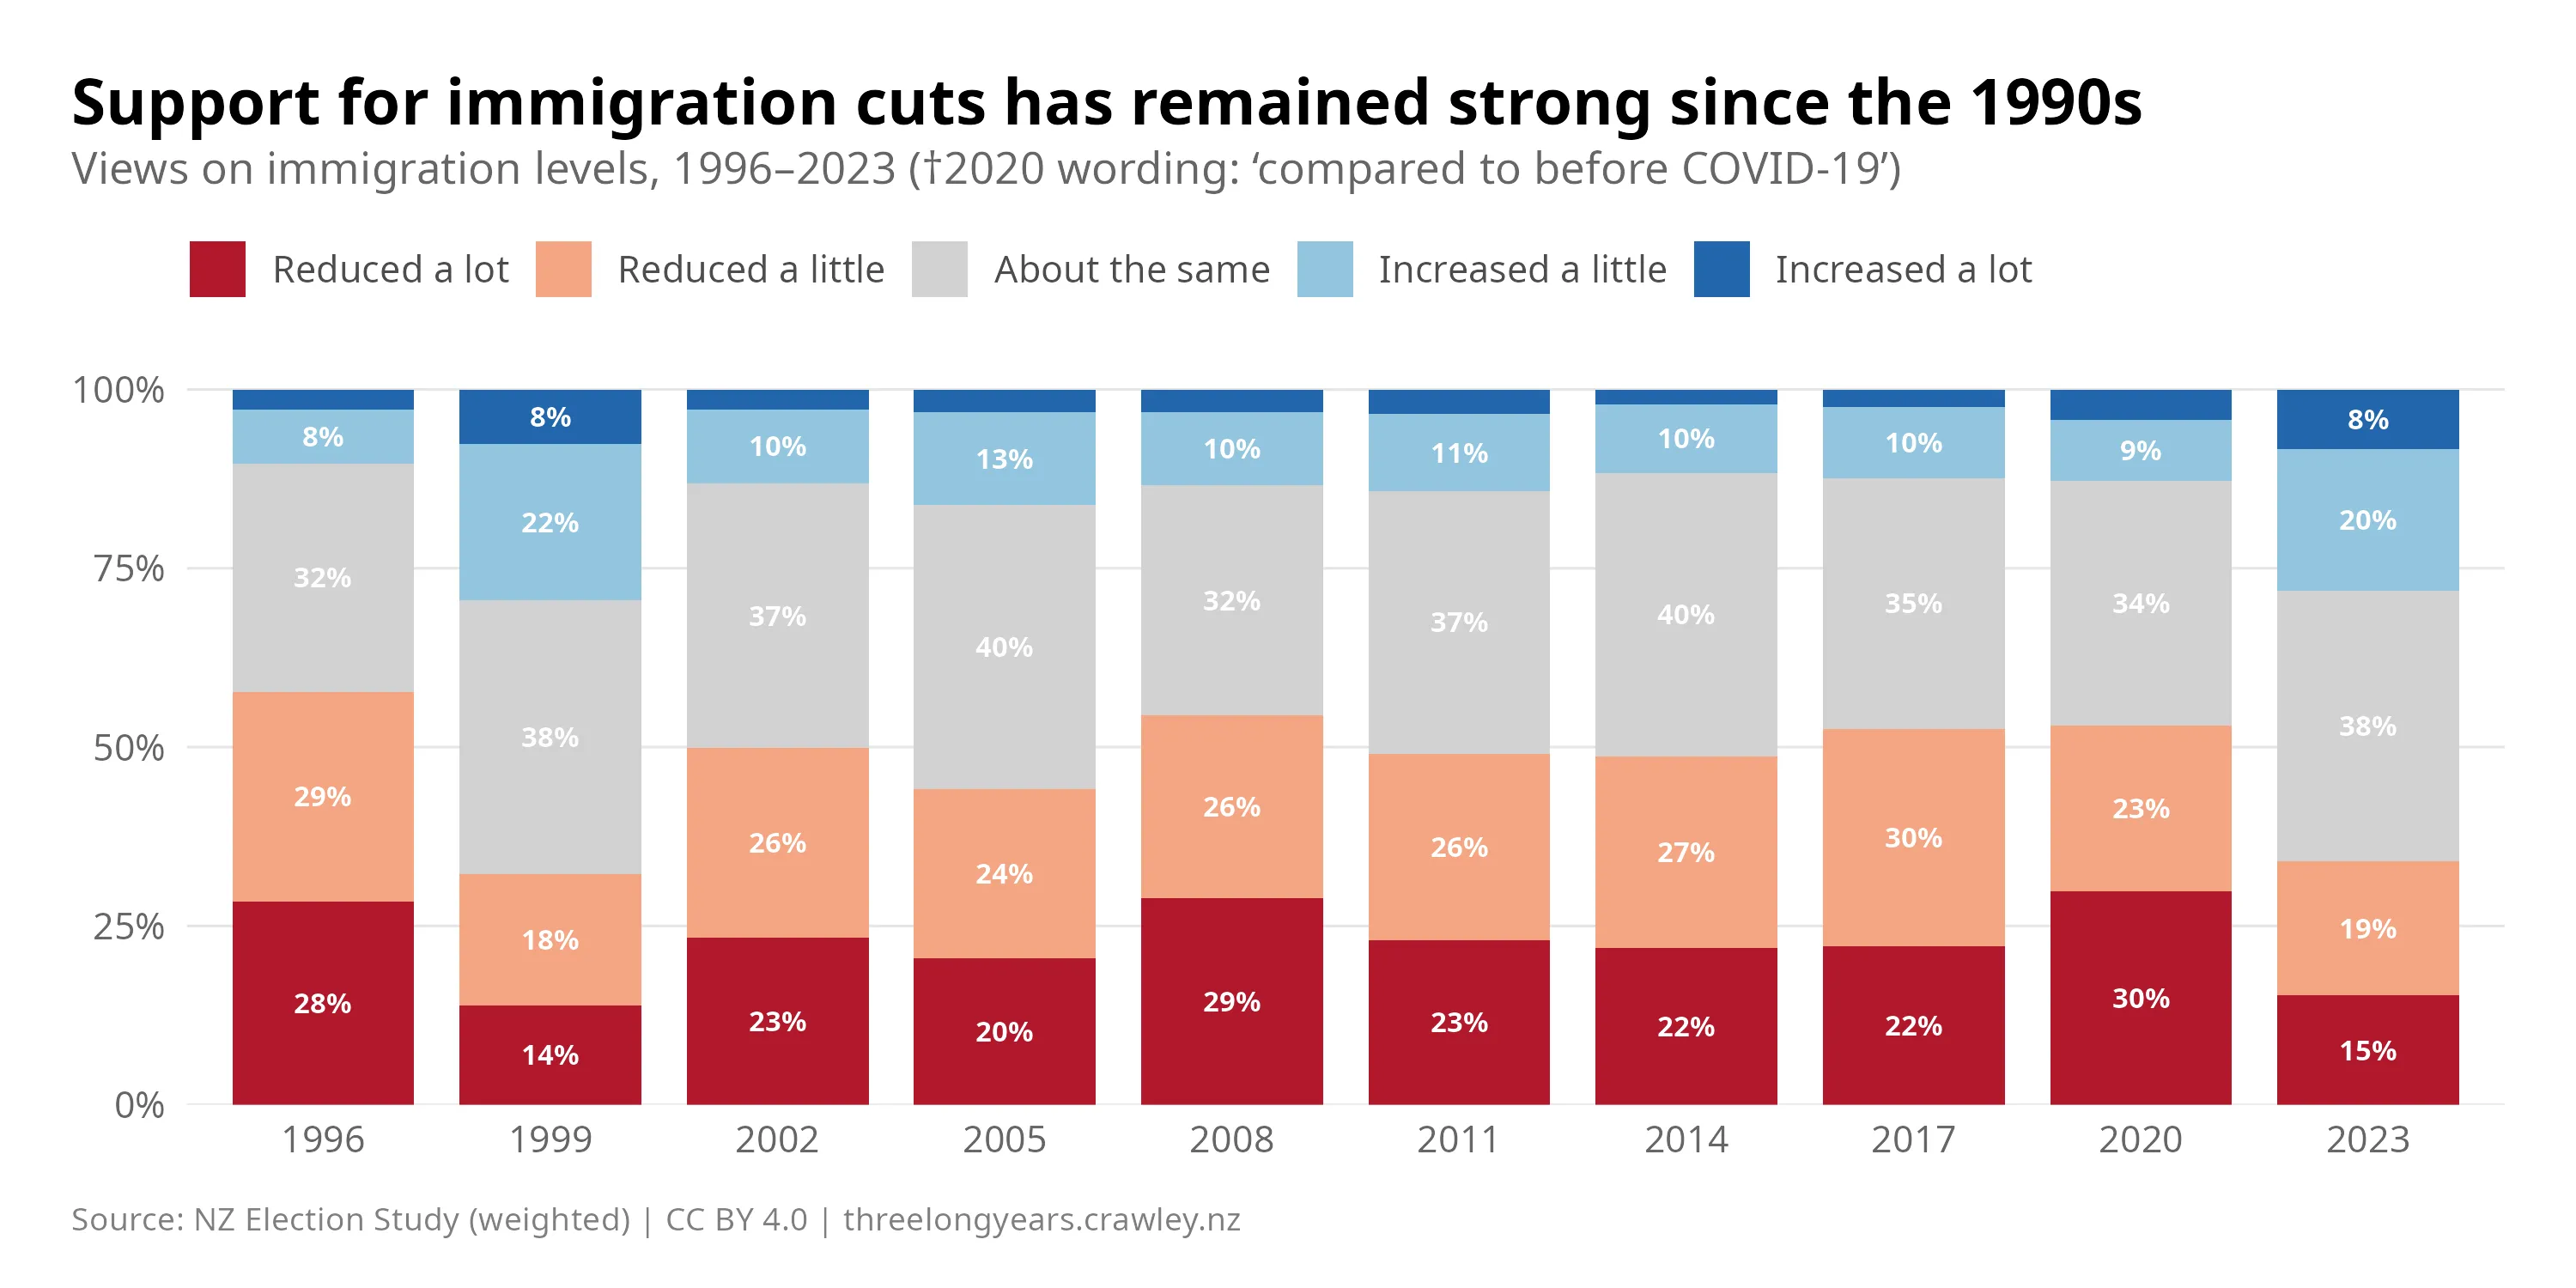
In most years, the percentage of NZES respondents wanting immigration to be reduced has been well over 40%, often a majority. Aside from 1999, the proportion of people wanting immigration reduced was actually lowest in 2023.1 One possible explanation is the post-pandemic period, where labour shortages may have shifted attitudes toward wanting more immigration to fill roles in the health system.
These headline numbers mask big differences between groups. Next, I turn to how immigration attitudes vary by the party people support.
Partisan perspectives
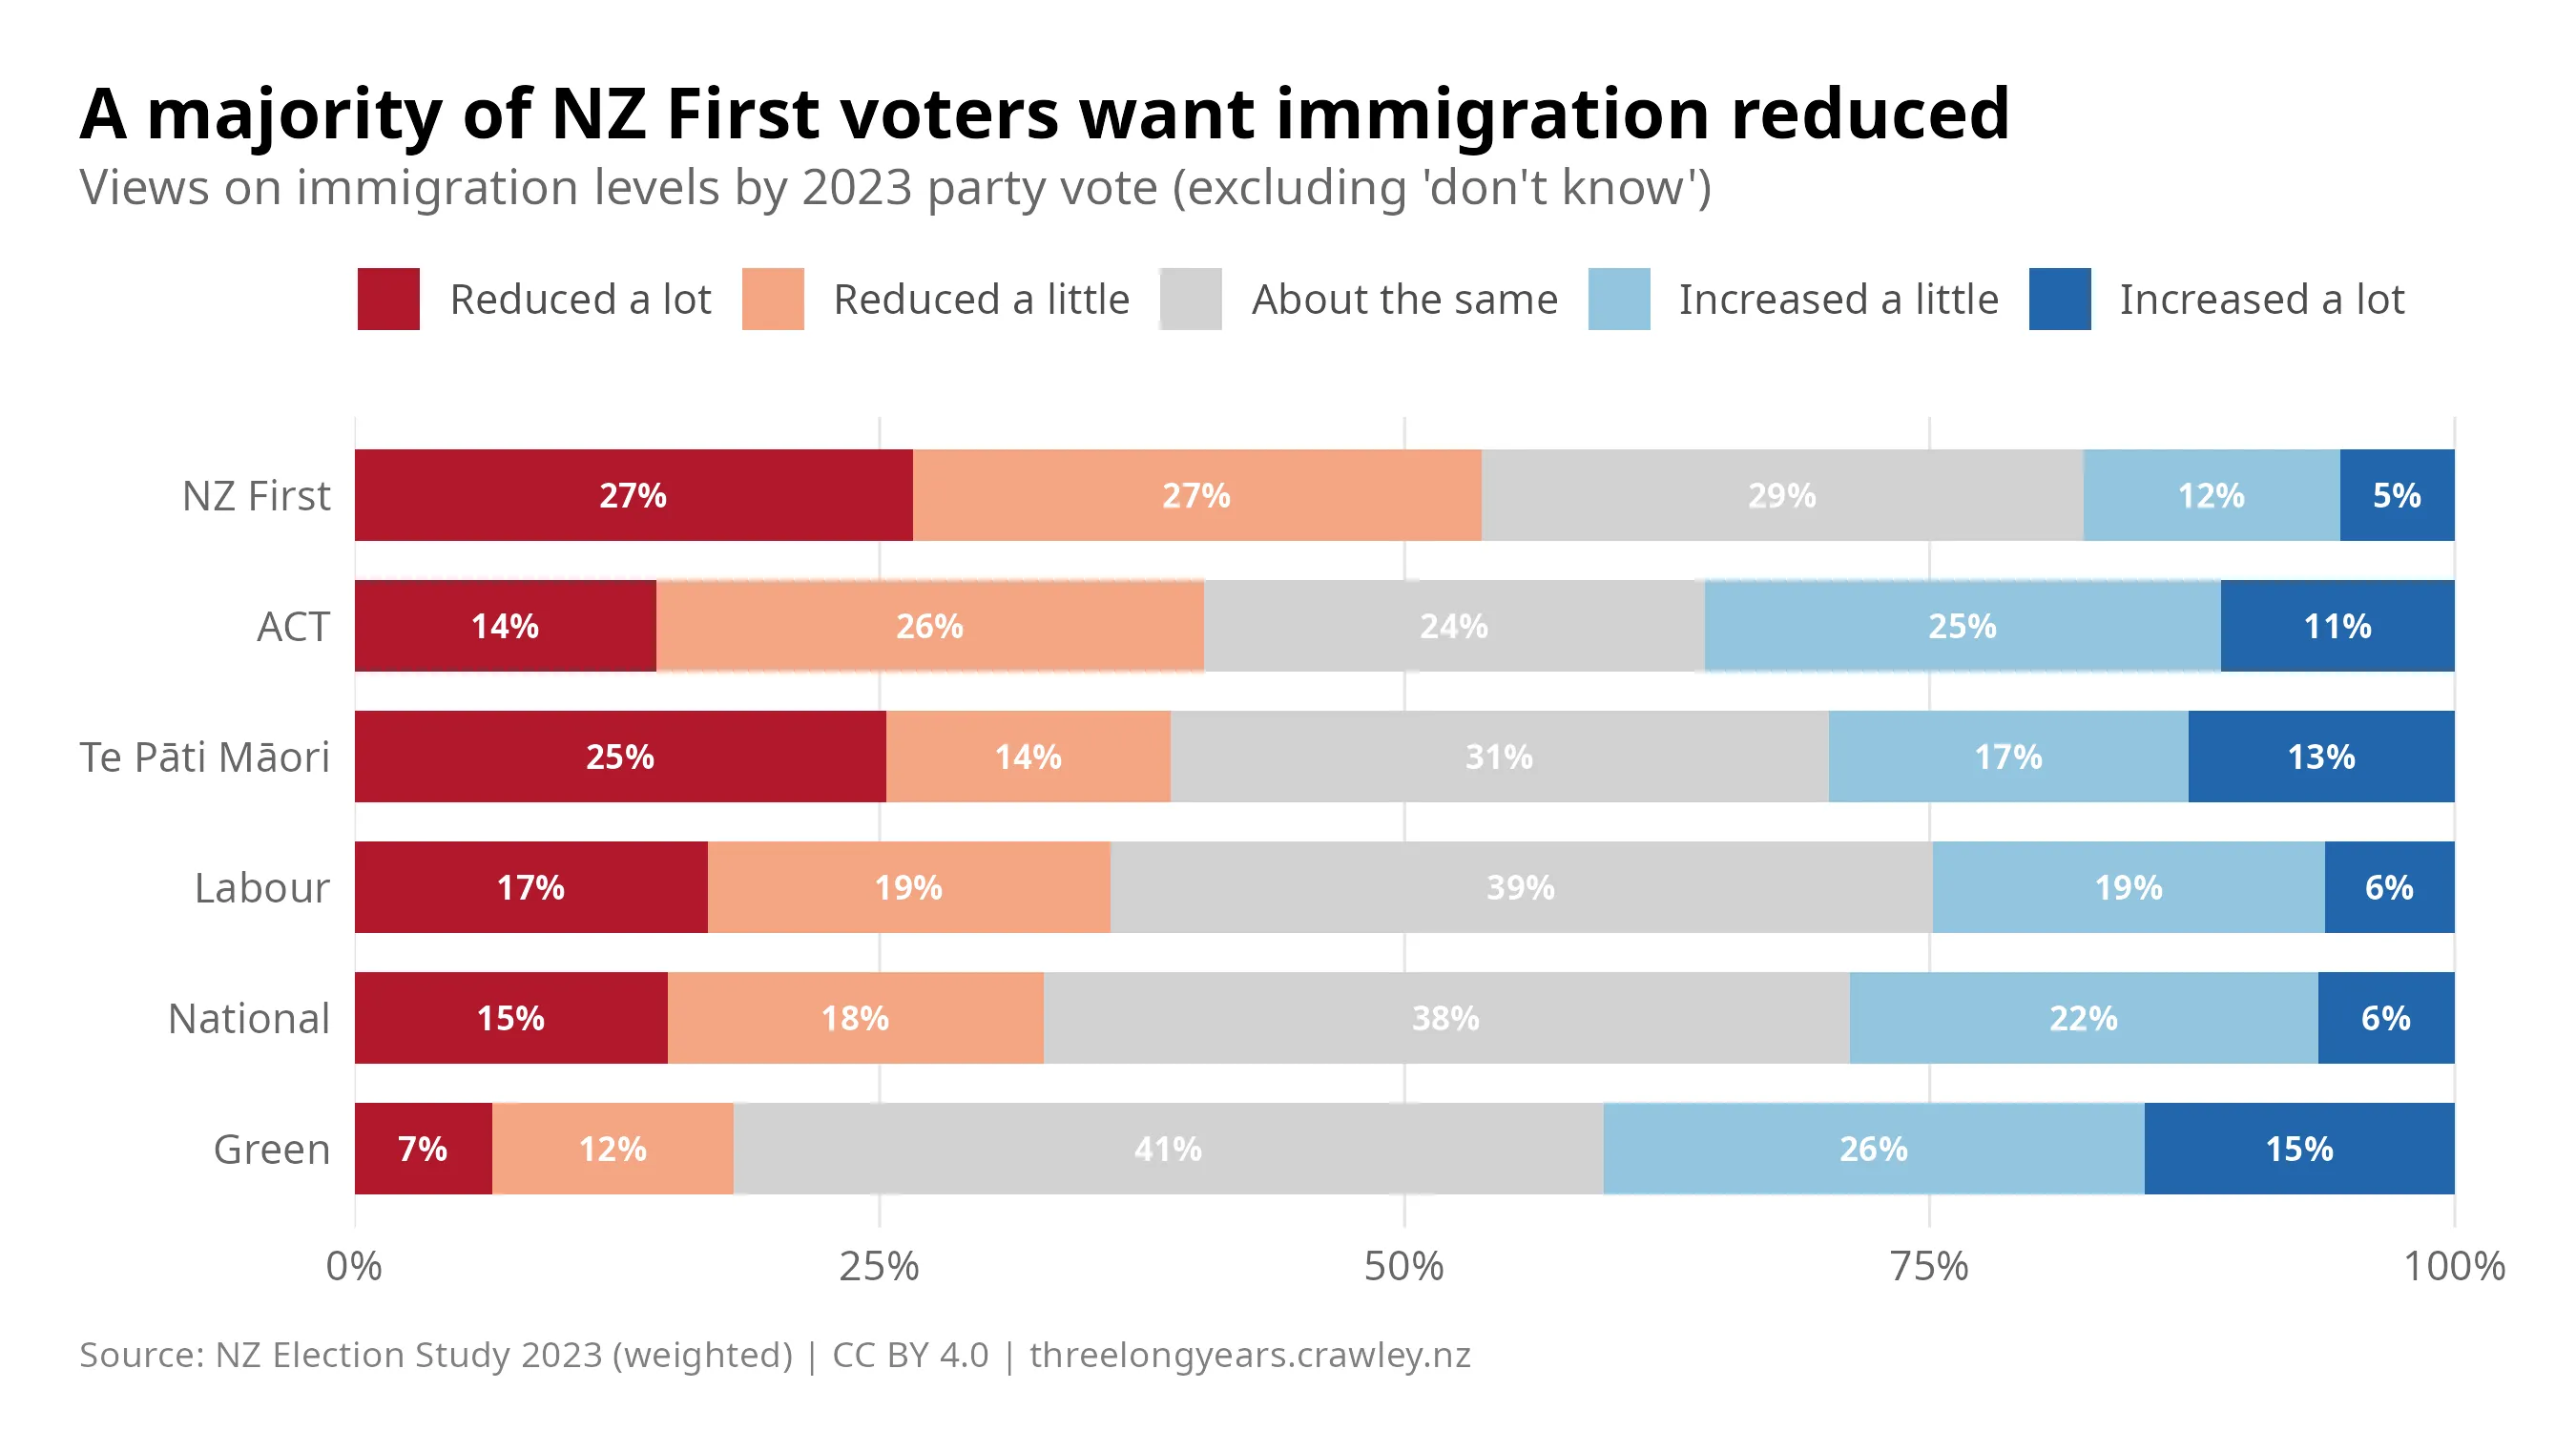
Despite relatively strong overall support for increased immigration in 2023, a majority of NZ First voters wanted immigration reduced. Labour and National voters had quite similar opinions on immigration, which closely matched the overall trend.
ACT supporters are the second most likely to want immigration reduced — but also the second most likely to want it increased — suggesting a divided base that ACT will have to navigate on this issue.
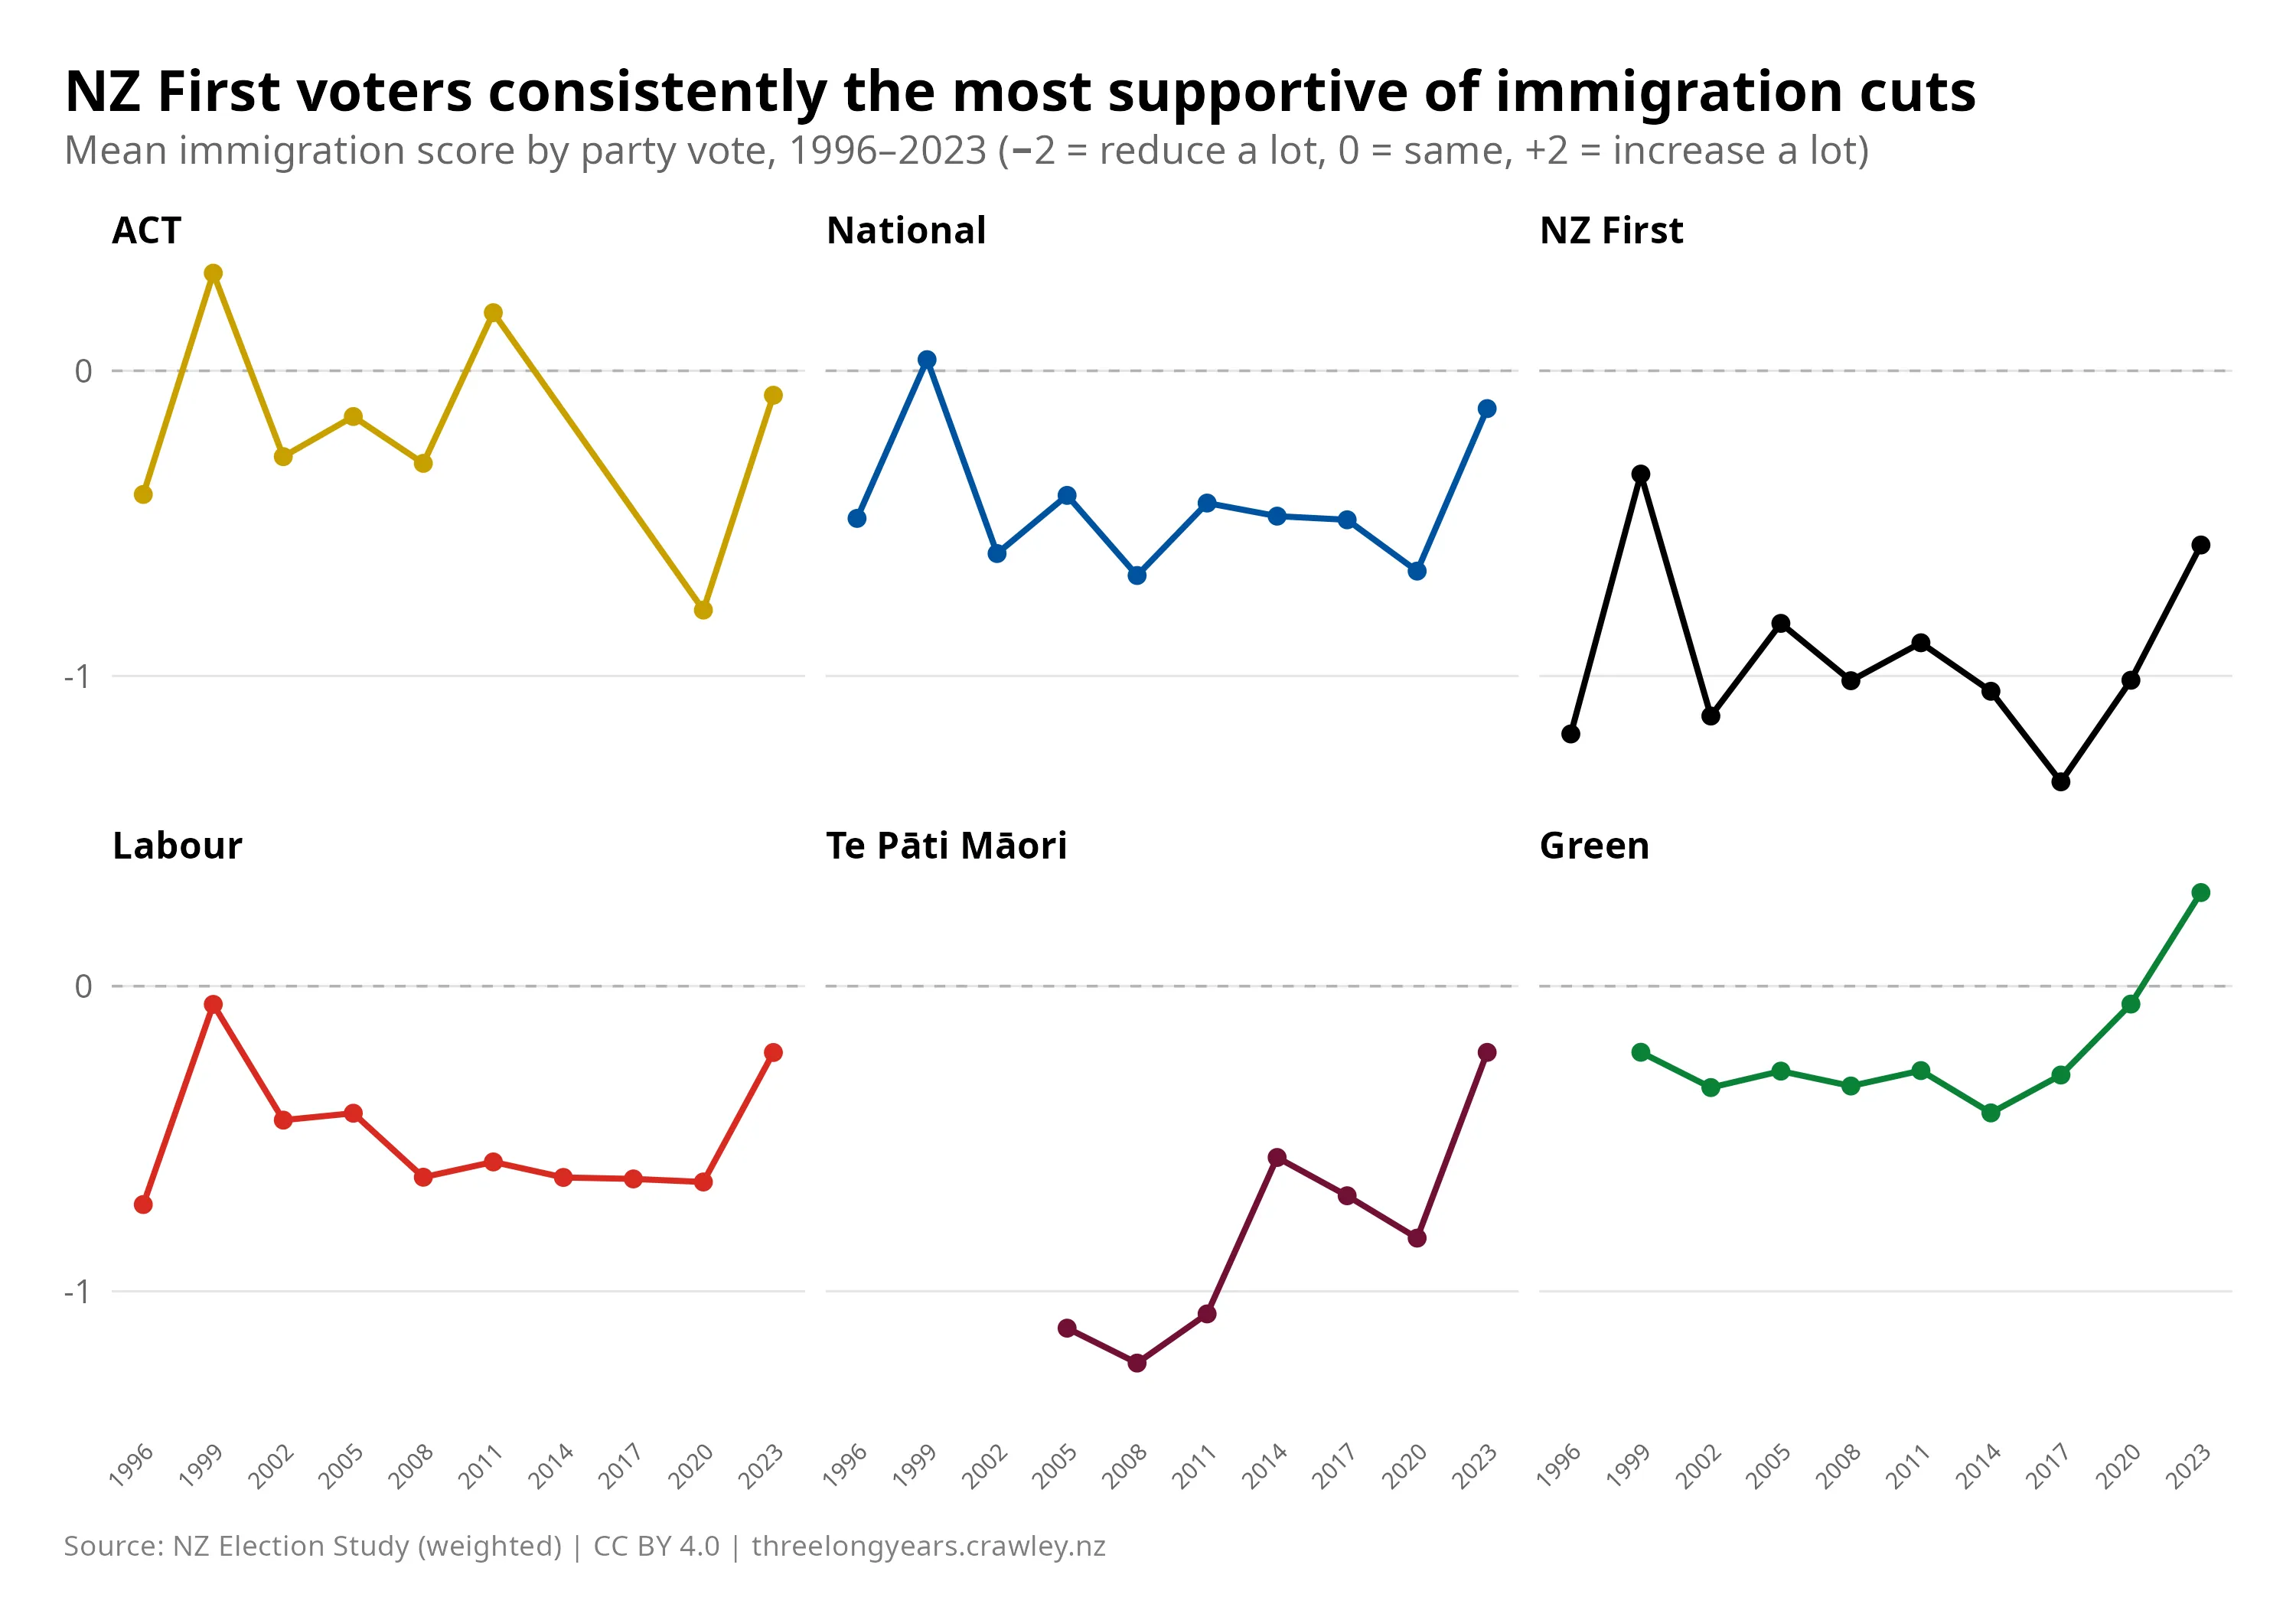
To compare trends across parties (Figure 3), I converted the five response categories to a numeric scale from −2 (reduce a lot) to +2 (increase a lot), and took the average for each party’s voters in each election year. In some elections, ACT supporters’ average score tipped above zero — meaning, collectively, they leaned toward wanting more immigration. National and Labour supporters, again, follow similar patterns, while NZ First supporters — in line with the history of the party — are consistently the least favourable towards immigration.2
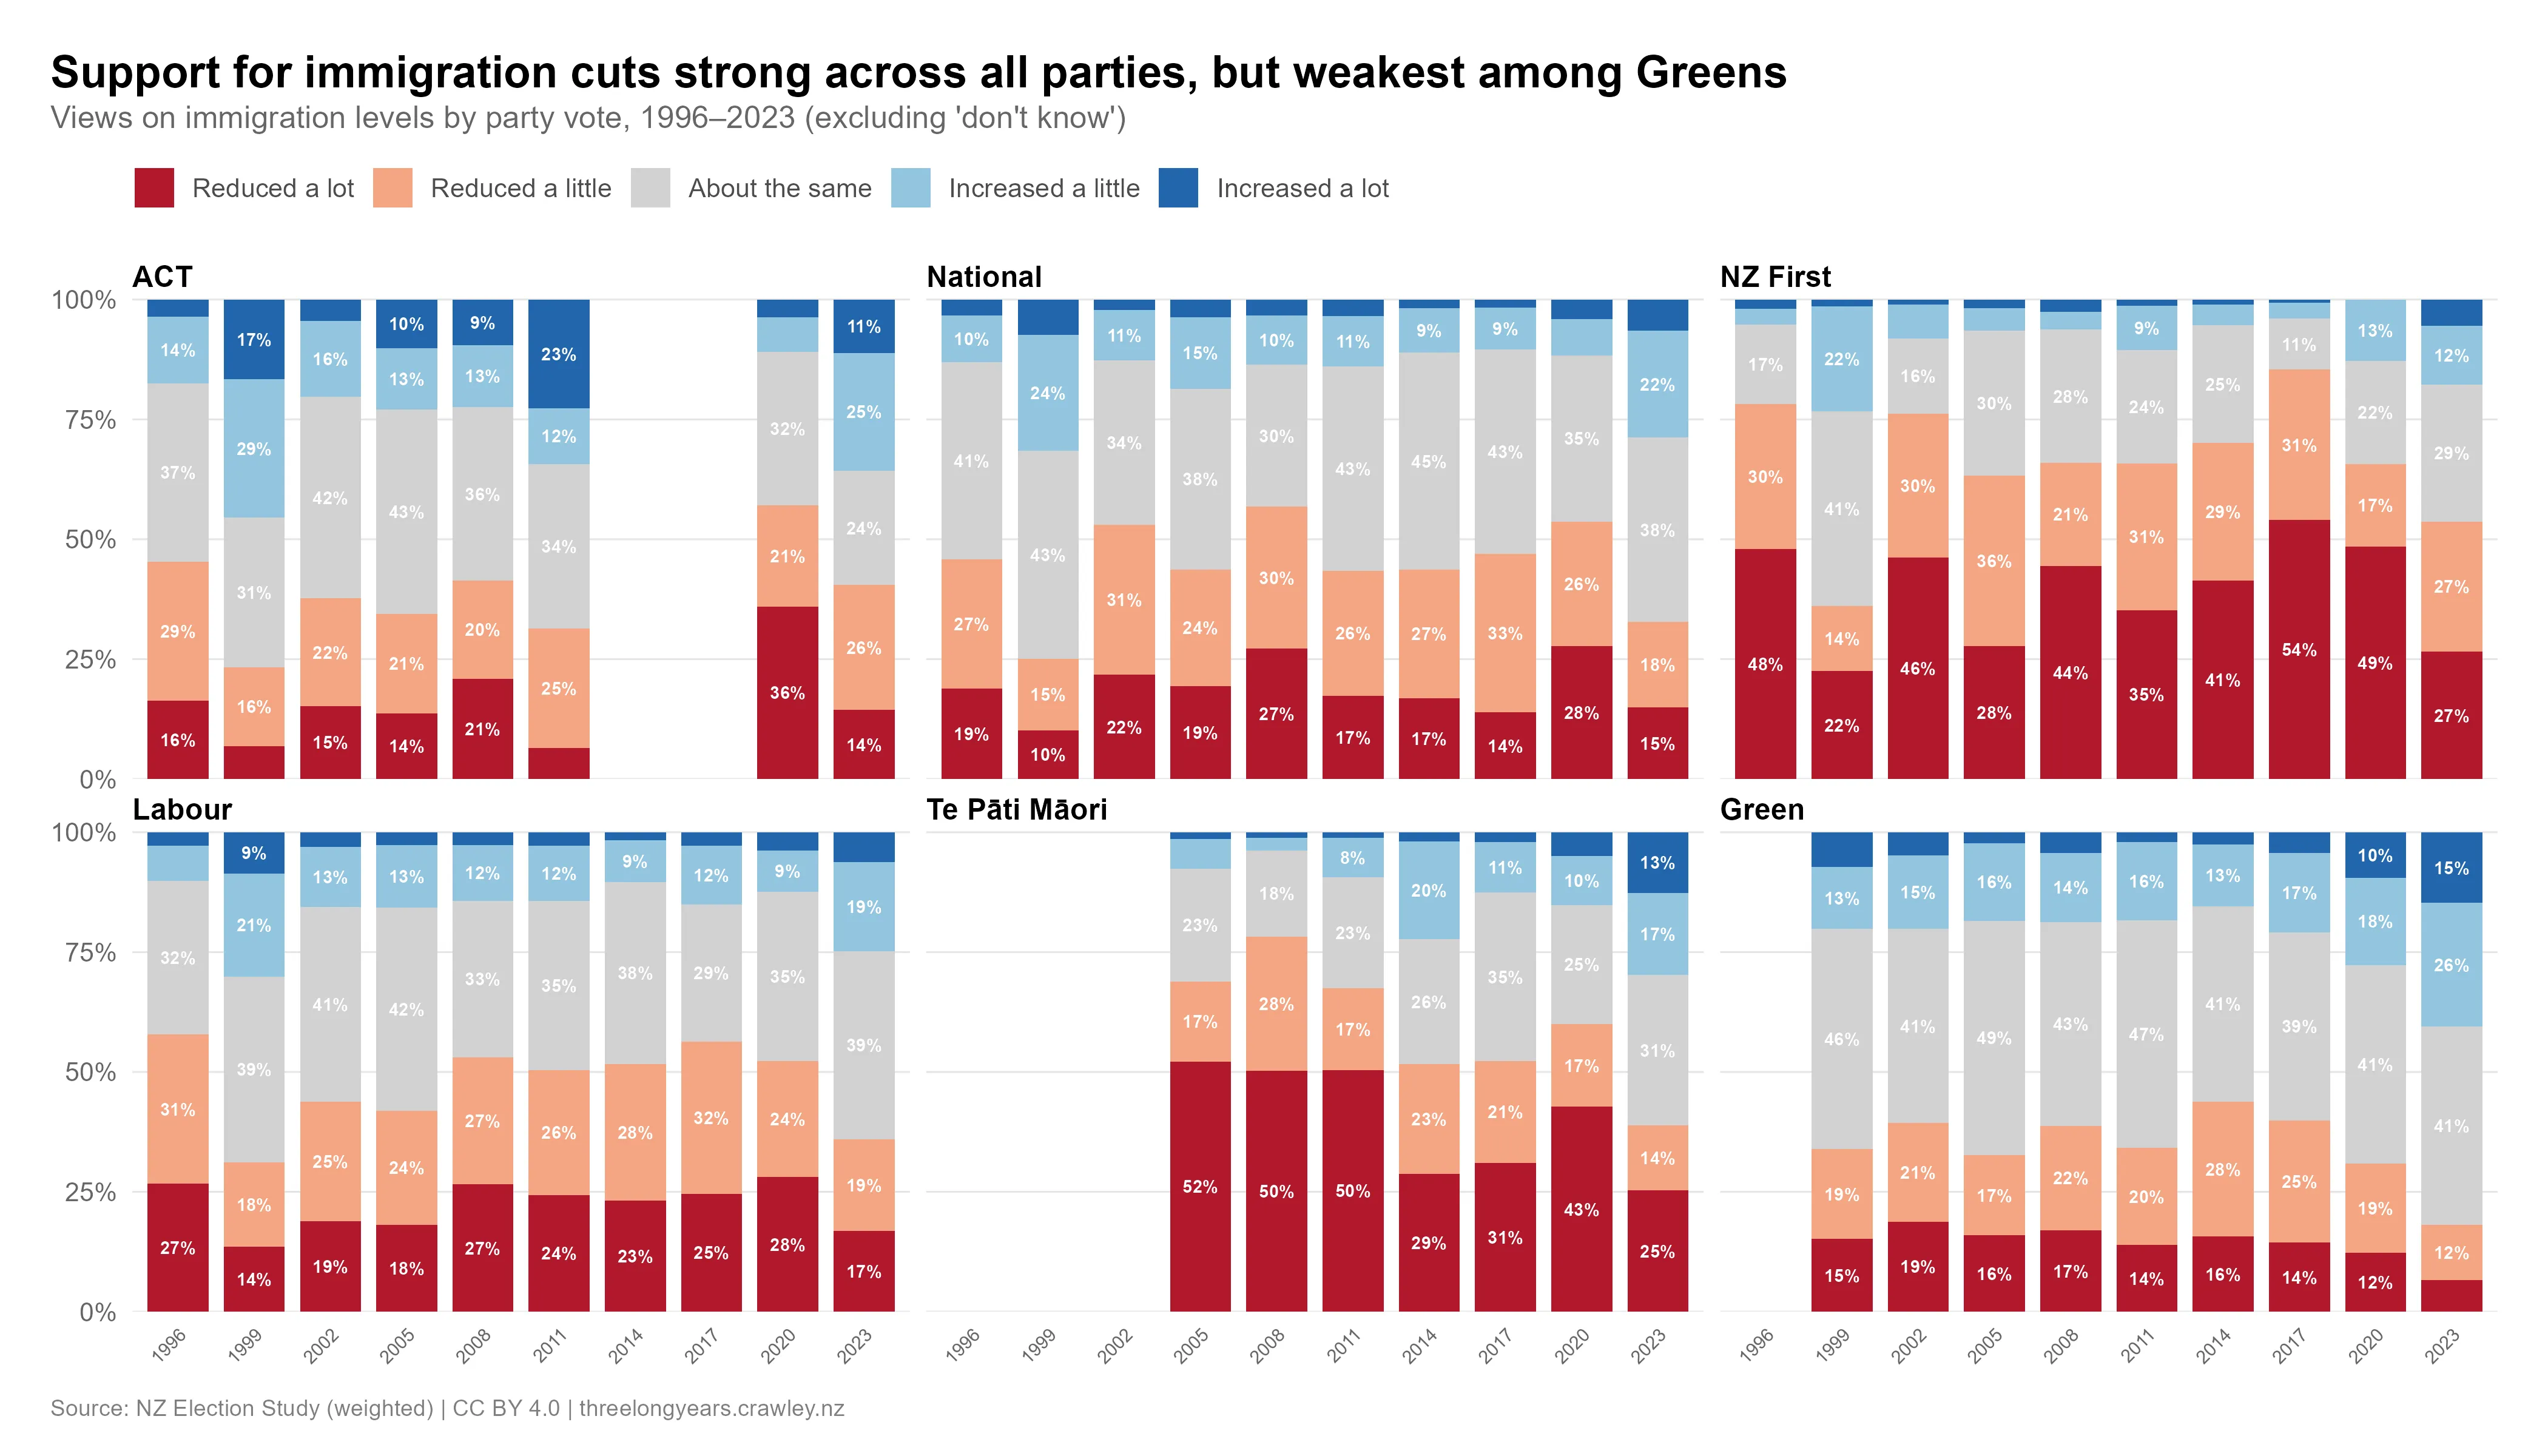
Views on immigration levels by party vote, 1996–2023
Immigration as an issue
Attitudes vary across parties — but how much voters actually care about immigration is a separate question. As I have argued in previous posts, it’s critical to consider not just what the public thinks about an issue, but the relative importance they place on it — what political scientists call its salience. The NZES asks respondents, in an open-ended question, to name the most important issue facing New Zealand at the election. Below, I show the percentage who cited “immigration” between 2008 and 2023.3
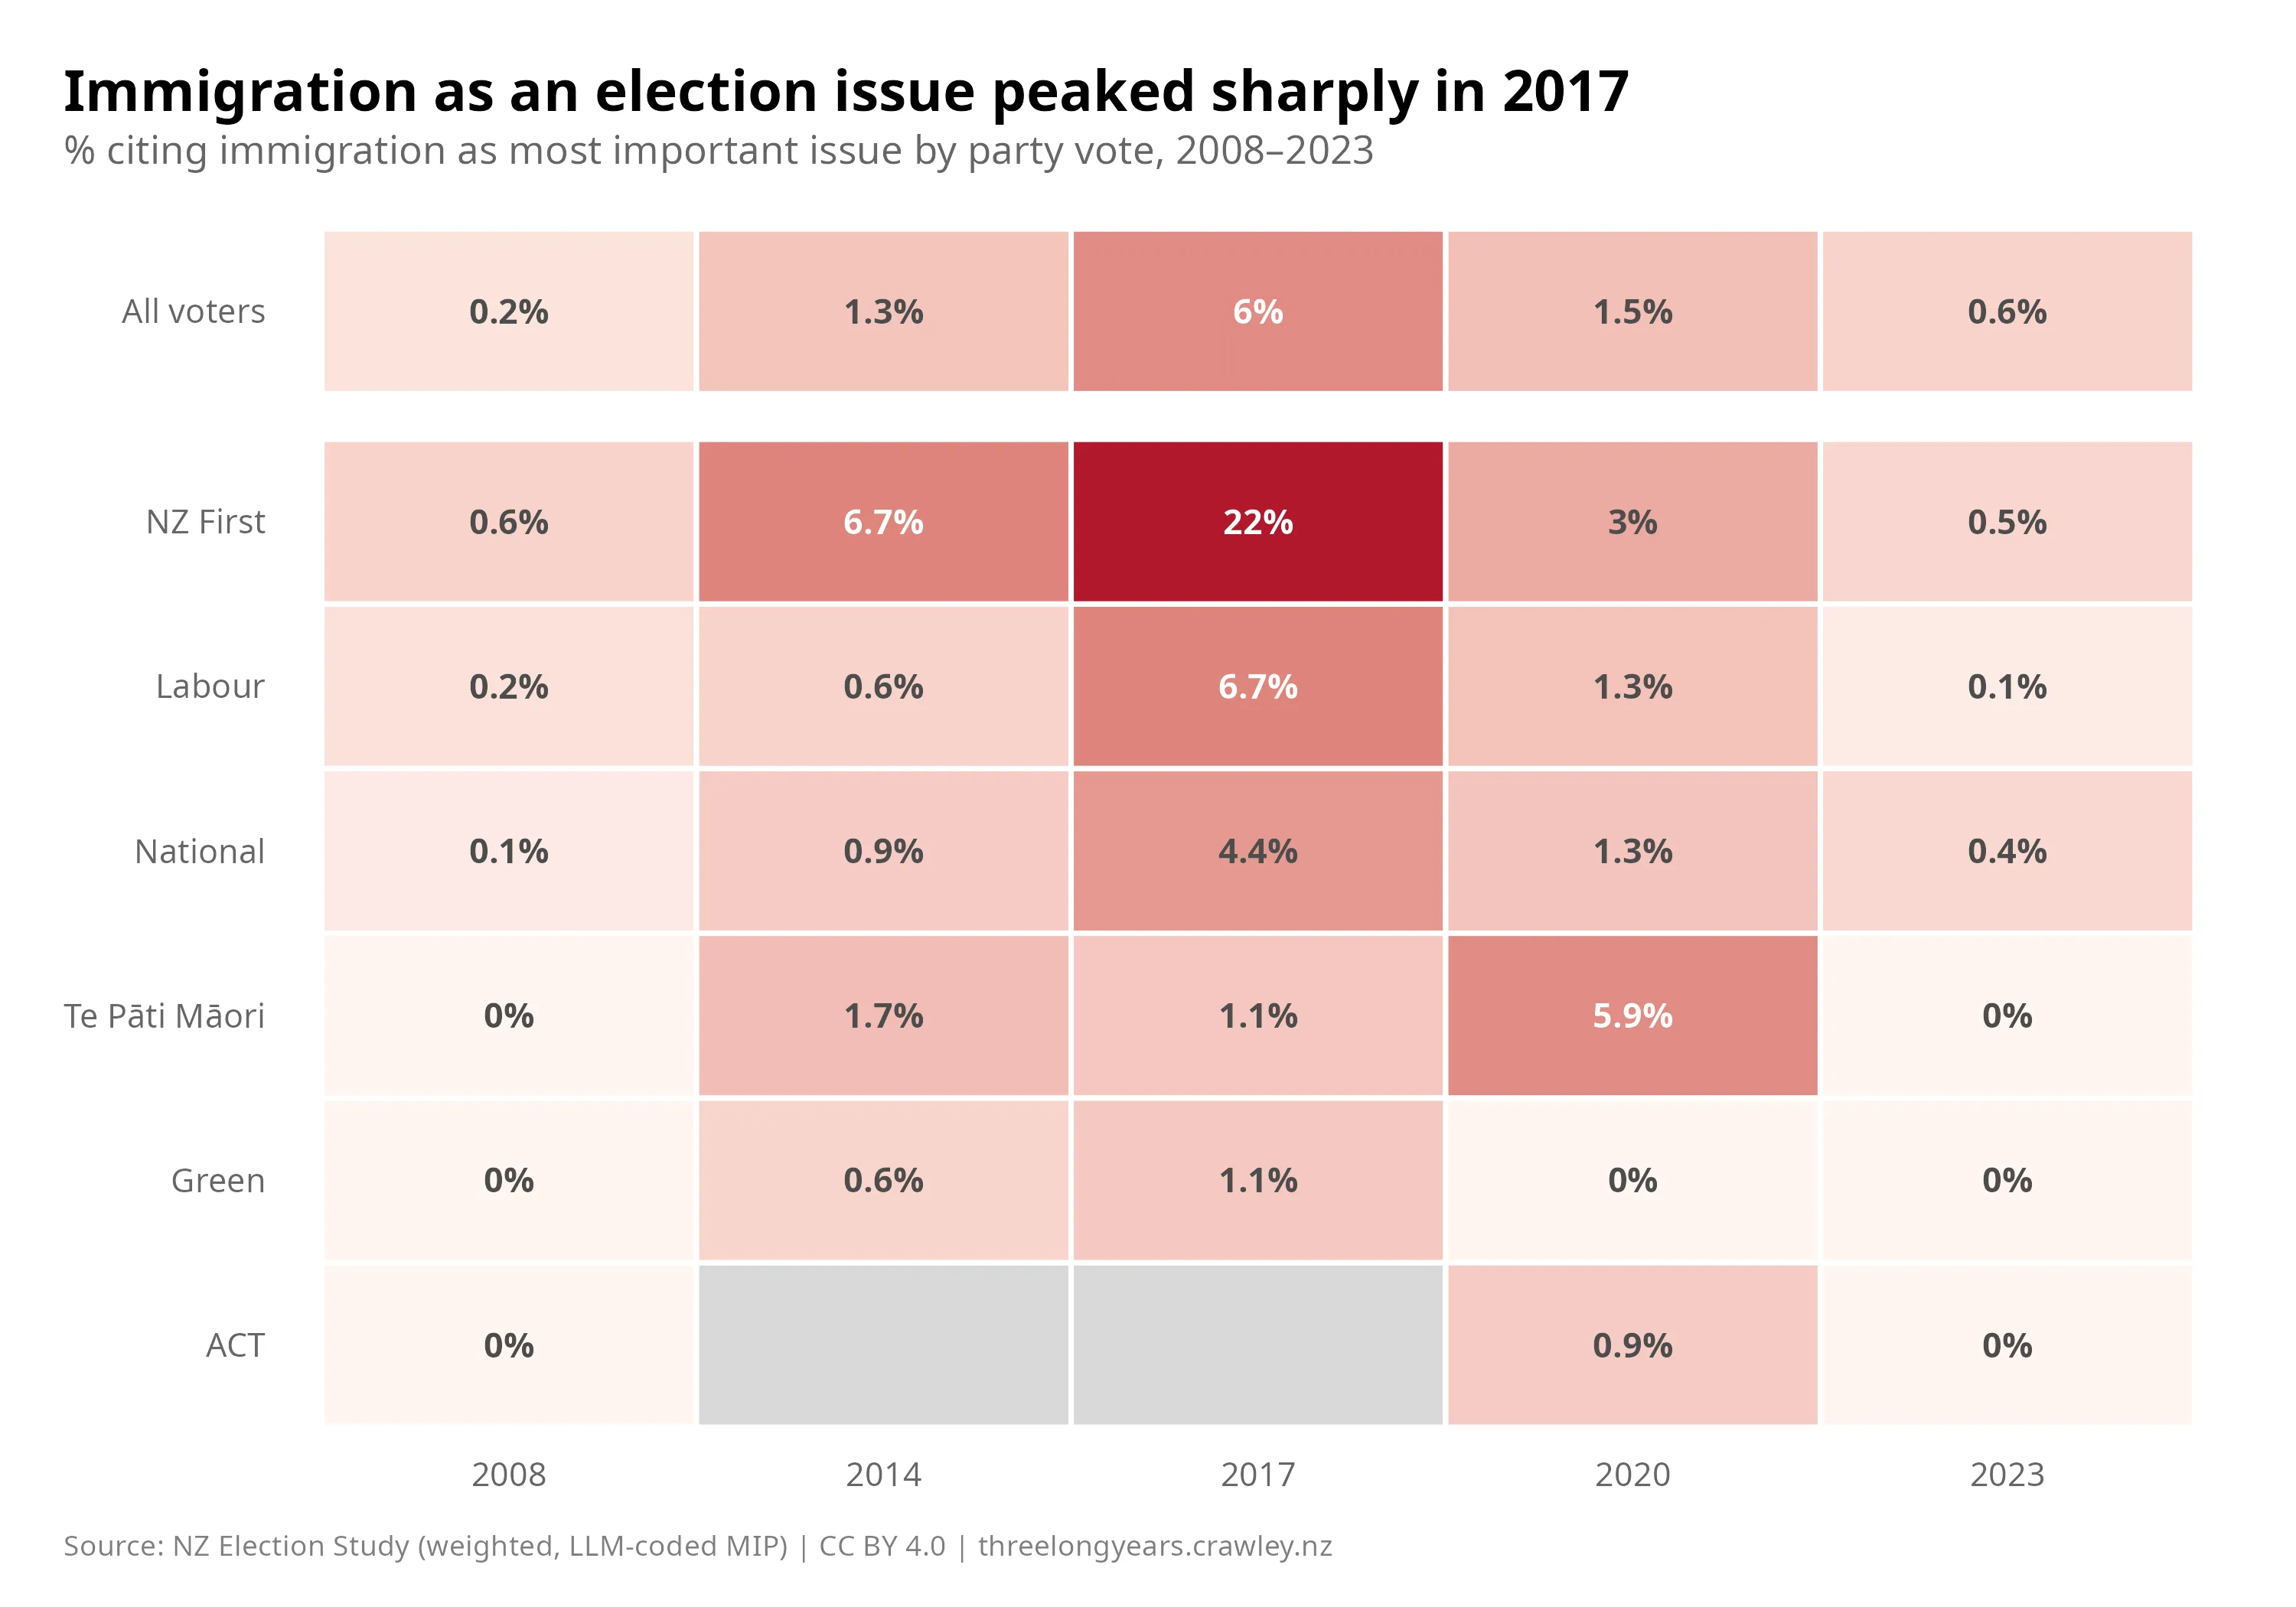
Immigration is an important issue for very few people, less than 2% in every year except 2017. In that year, New Zealand First campaigned hard on immigration, and in campaign debates, the issue was linked to housing. Although overall opposition to immigration did not change much (as shown in Figure 1), it became a more salient issue that year. That said, it was a long way off the more important issues of 2017: poverty & inequality, housing and the economy.
The low relative importance of immigration as an issue in New Zealand contrasts with many other countries around the world. In the UK, 41% of people view immigration control as one of the most worrying issues. In Australia it is 23%, and many European countries are above 20%.
The most recent Ipsos data for New Zealand (March 2026) puts the figure at 8% — still well below those comparators, though the different methodology and three-year gap to the NZES data make direct comparison difficult.4 Whether that 8% climbs by election day, and whether ACT and NZ First can push it higher, is one of the questions 2026 will answer.
A historical pattern — and whether it holds
The overall partisan picture is broadly what you’d expect: Green voters are the most pro-immigration, NZ First voters the most opposed, with Labour and National sitting closer to the middle.
NZ First has — throughout its history — opposed high levels of immigration, and its supporters are largely behind these policies. However, immigration has not always been a high importance issue for NZ First and its voters. While the party’s overall position on immigration might be stable, salience rises and falls.
The ACT party’s relationship with immigration is more complex. Traditionally a free-market and pro-business party, ACT has clearly broadened its focus in recent years — leaning into what it frames as “fairness” and opposition to “race-based policies”, most visibly through the Treaty Principles bill. The party has clearly signalled it wants to focus on reducing immigration in this year’s election — and in doing so, arguably risks alienating some of its base of business owners who rely on immigration to recruit workers.
Even though a substantial section of the NZ public (often a majority) want immigration reduced, it has not typically been a critical election issue. Judging by their policy positions, both NZ First and ACT see 2026 as different — they’re betting immigration will be key to winning votes. If that bet pays off, it could mark a real change in how immigration fits into NZ politics. Next week, I’ll look at how immigration has historically been thought of by the NZ public.
Footnotes
-
In the late 1990s, immigration to NZ decreased substantially (partly due to the Asian financial crisis). By 1999, immigration flows were actually a net negative (more people leaving than arriving). This probably explains the higher than usual support for increasing immigration in 1999. ↩
-
Te Pāti Māori supporters have also historically been opposed to immigration. However, in many of the years, the sample sizes are small. The sample sizes for ACT supporters in 2014 and 2017 were very small. Average scores for ACT in those years are thus excluded from the figure. ↩
-
The “most important question” issue was not asked in 2011, and it is thus excluded from this analysis. ACT data is also unavailable for 2014 and 2017 due to small sample sizes (shown as grey cells in the figure). ↩
-
The Ipsos polls allow people to choose up to three issues they worry the most about. This could account for some of the difference to the NZES numbers, where respondents are prompted to give their most important issue only. ↩
The analysis code for this post is available on Codeberg.
View code on Codeberg →