Is there room for a blue-green party? Environmental opinion in New Zealand
When the German Green party first came to prominence in the 1980s, their slogan proclaimed: “We are neither left nor right; we are in front”. Yet ever since, it’s been clear that left-leaning parties tend to care more about environmental issues than right-leaning parties do. Almost every Green party around the world — including the Green Party of Aotearoa New Zealand — is aligned well to the left of the political spectrum.
That said, there are clearly some on the right who care deeply about the environment. The current Parliamentary Commissioner for the Environment Simon Upton, for example, is a former National party minister. There have, at times, been calls for a centrist or even right-leaning “blue-green” environmental party in NZ to serve this constituency. Previous attempts to launch such a party have, however, been abject failures.1
Today, I use New Zealand Election Study (NZES) data to investigate how much Kiwis support action on the environment, and how this splits along left–right and partisan lines. I also show how NZ compares globally.
Support for environmental action is strong
The two measures of environmental opinion I use in this analysis are people’s support for government spending on the environment (do they want more or less), and people’s opinion on whether protecting the environment is more important than improving the economy.
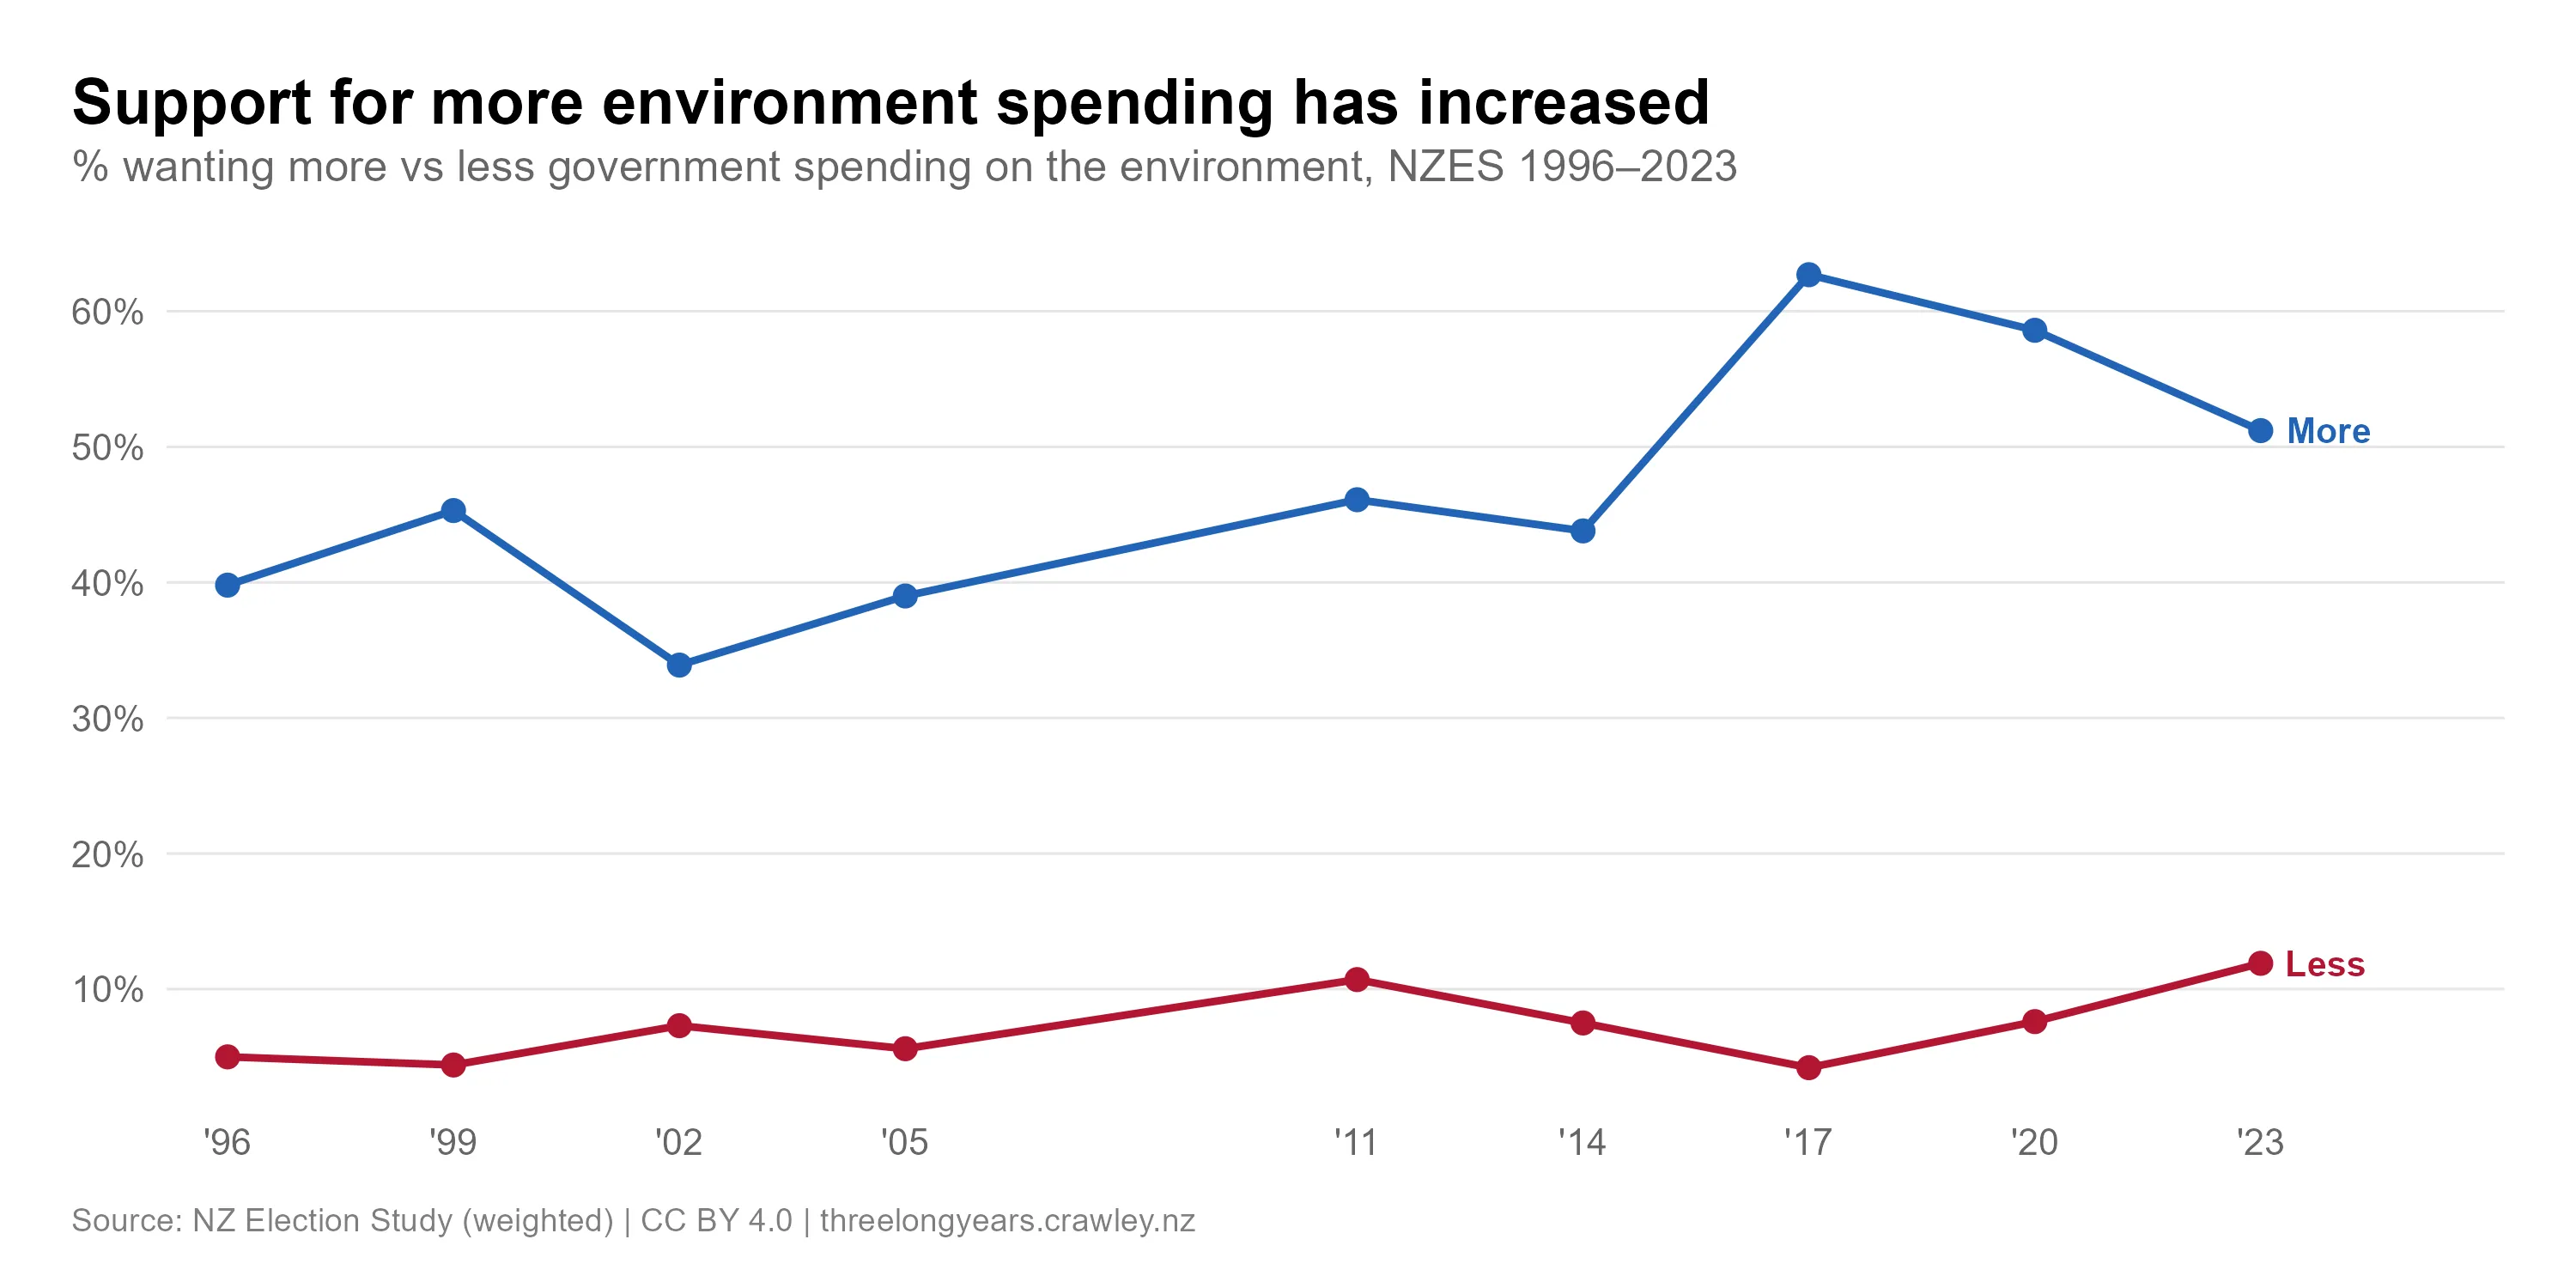
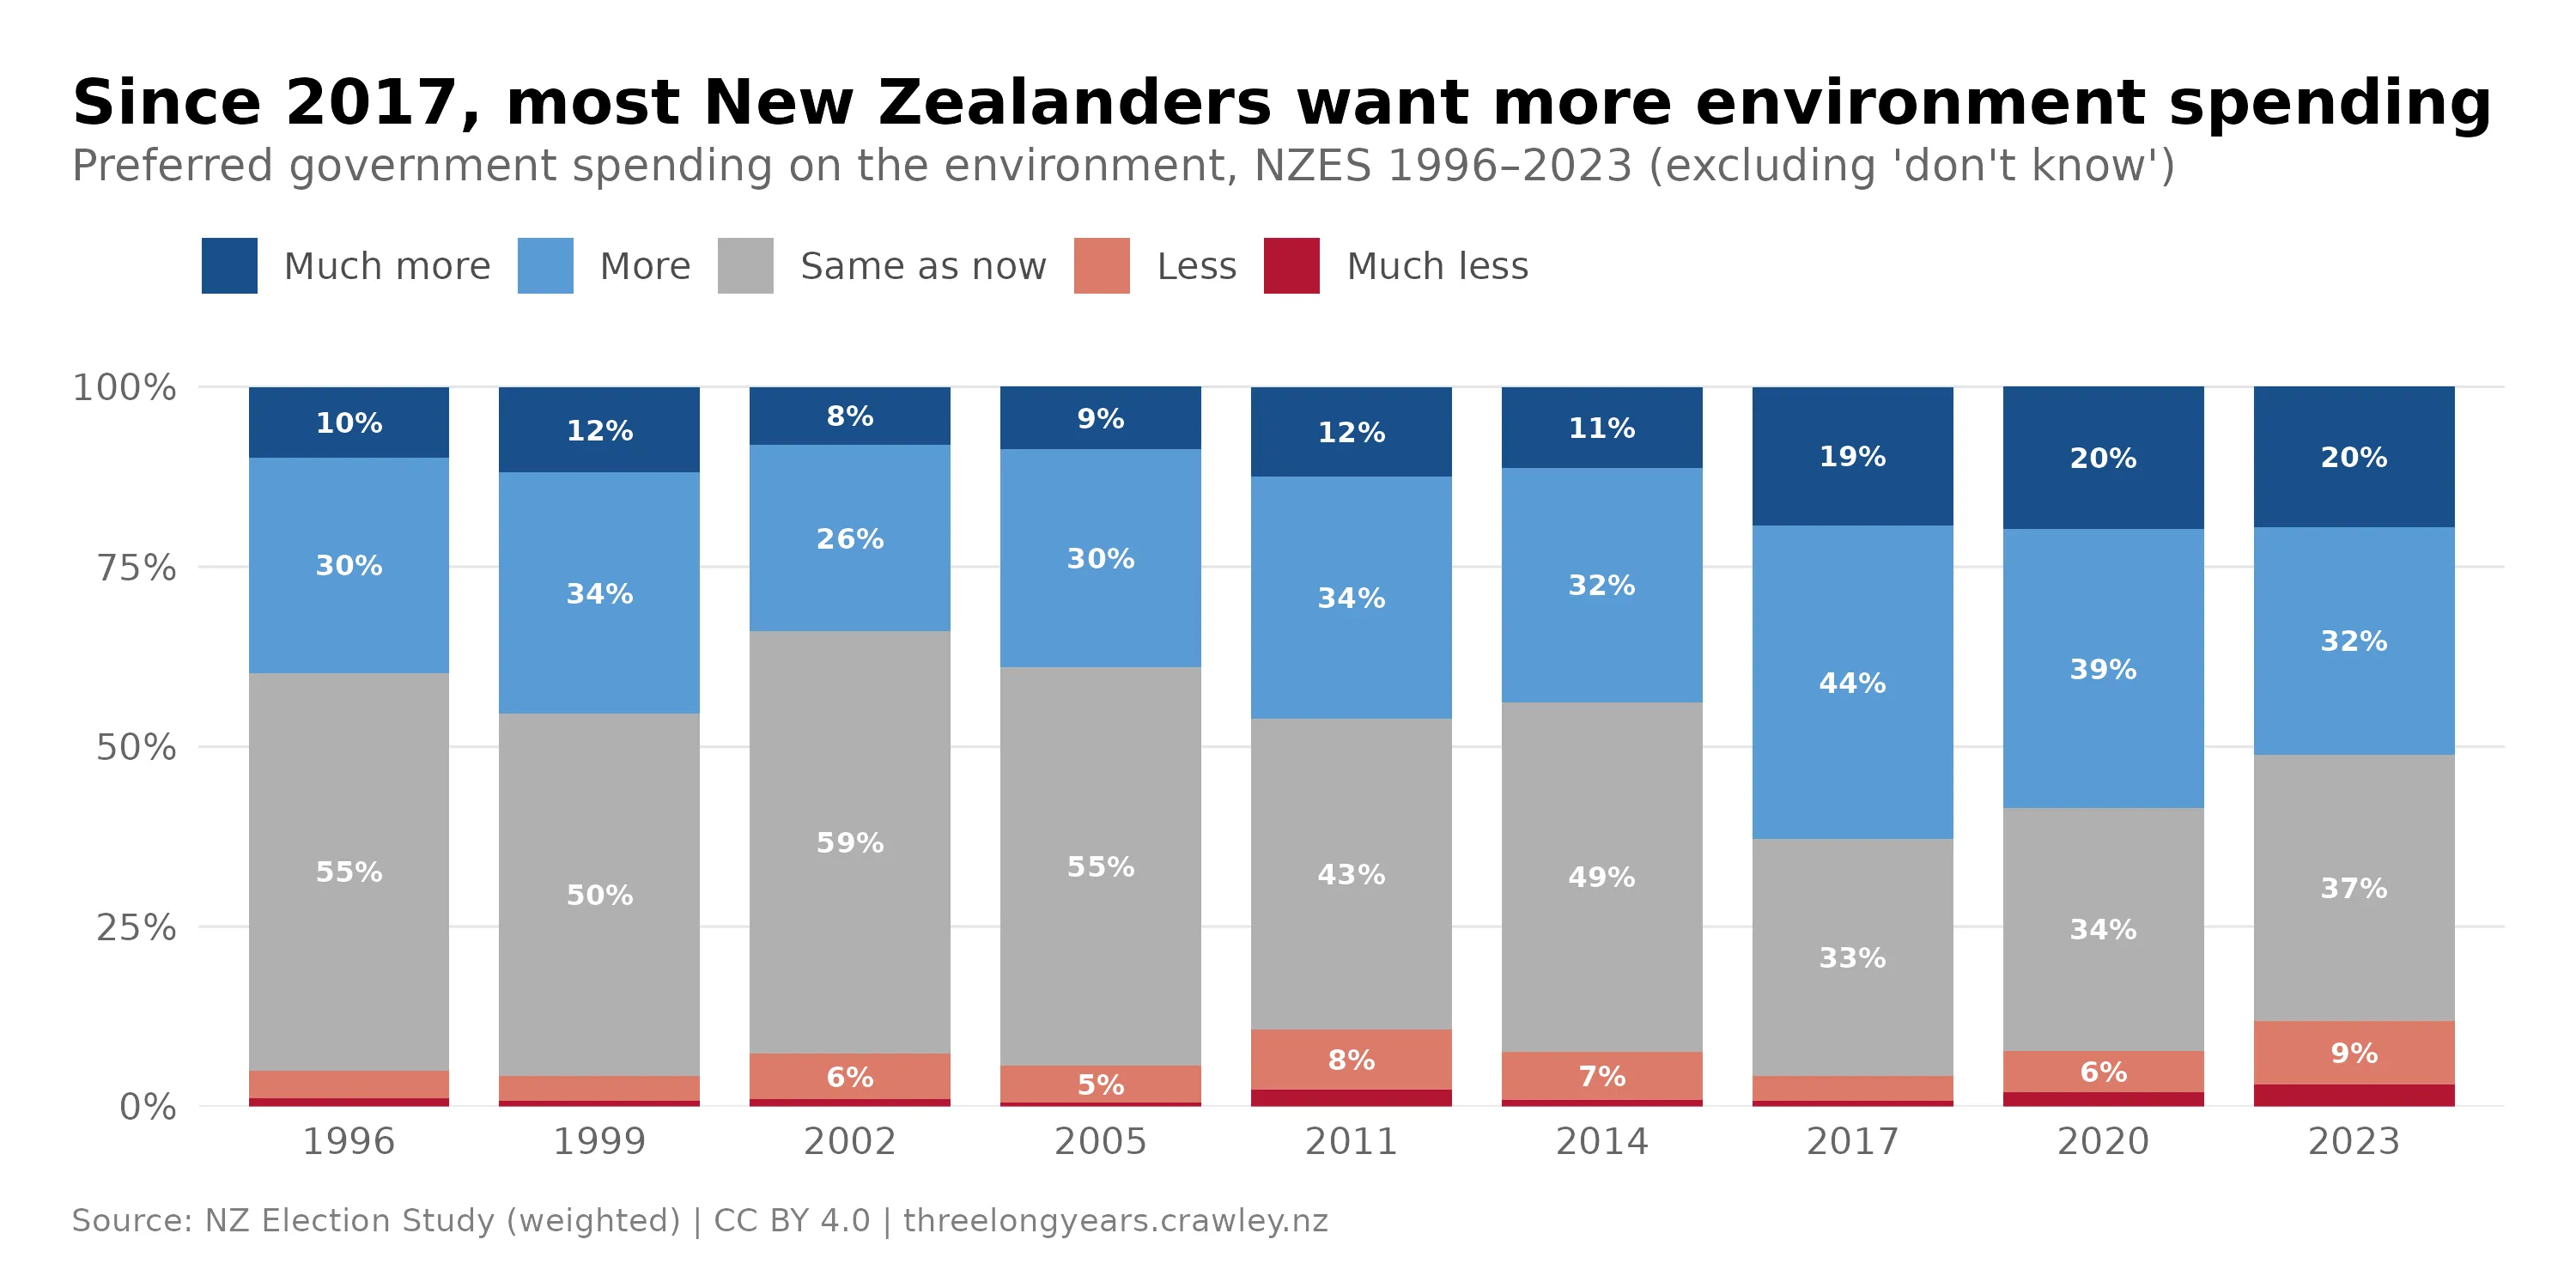
Overall, the NZ public supports action on the environment. Only a small percentage of people want less spending on the environment, and — since 2017 — a majority want more.2
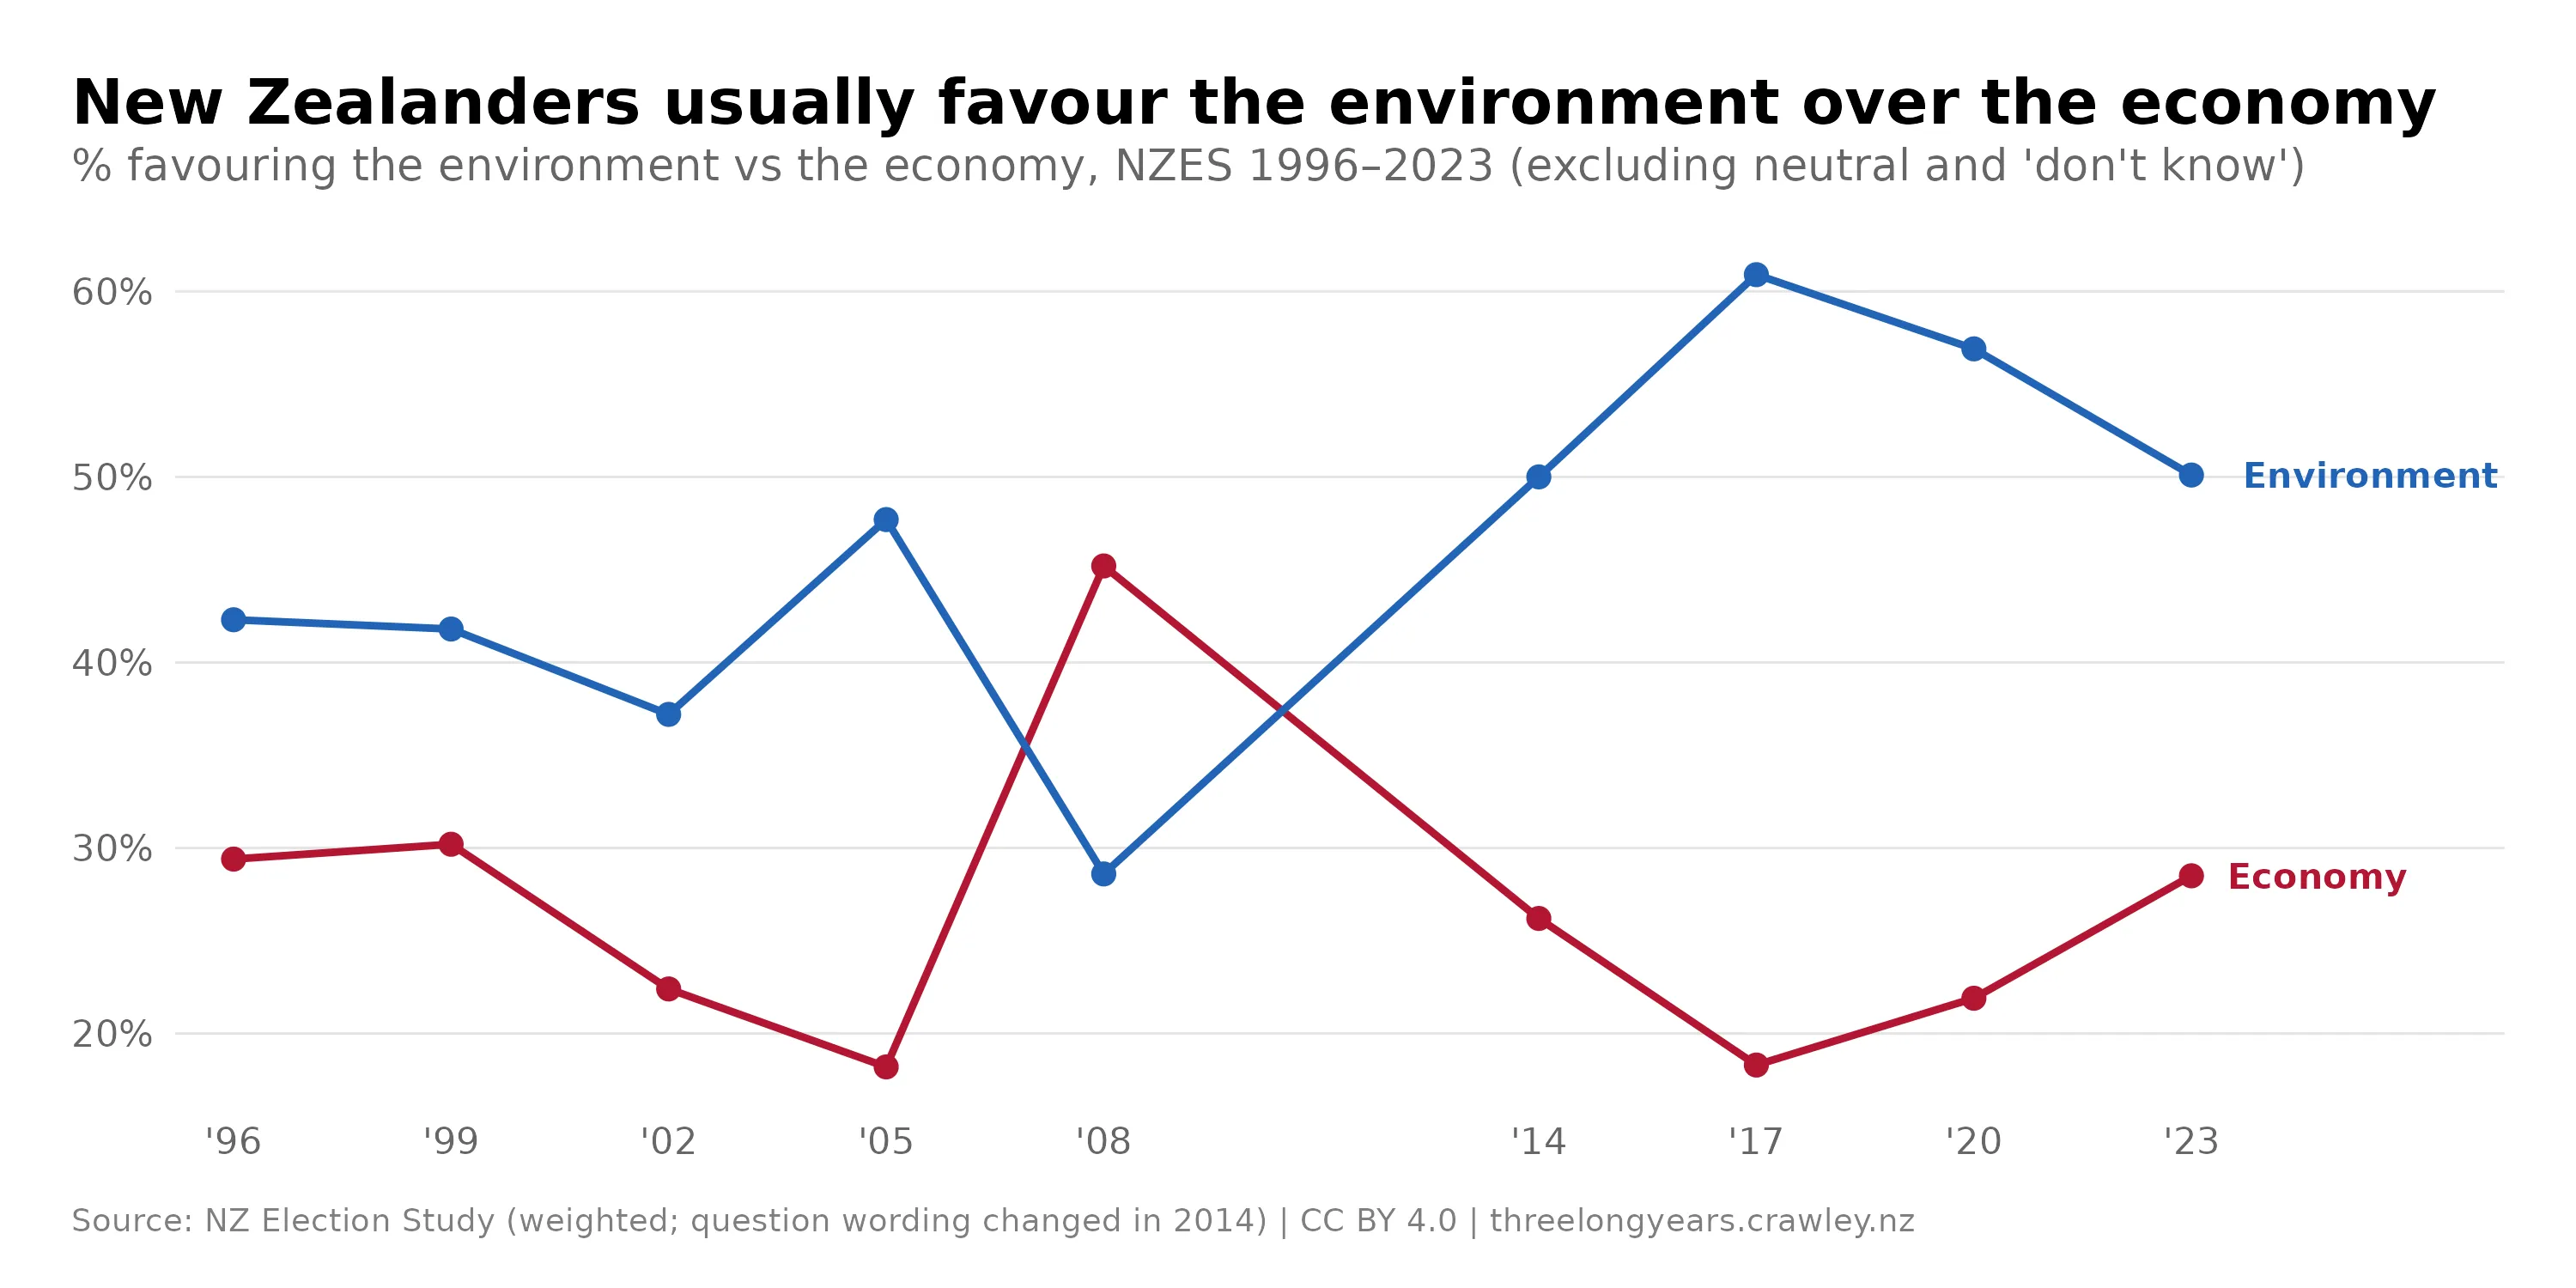
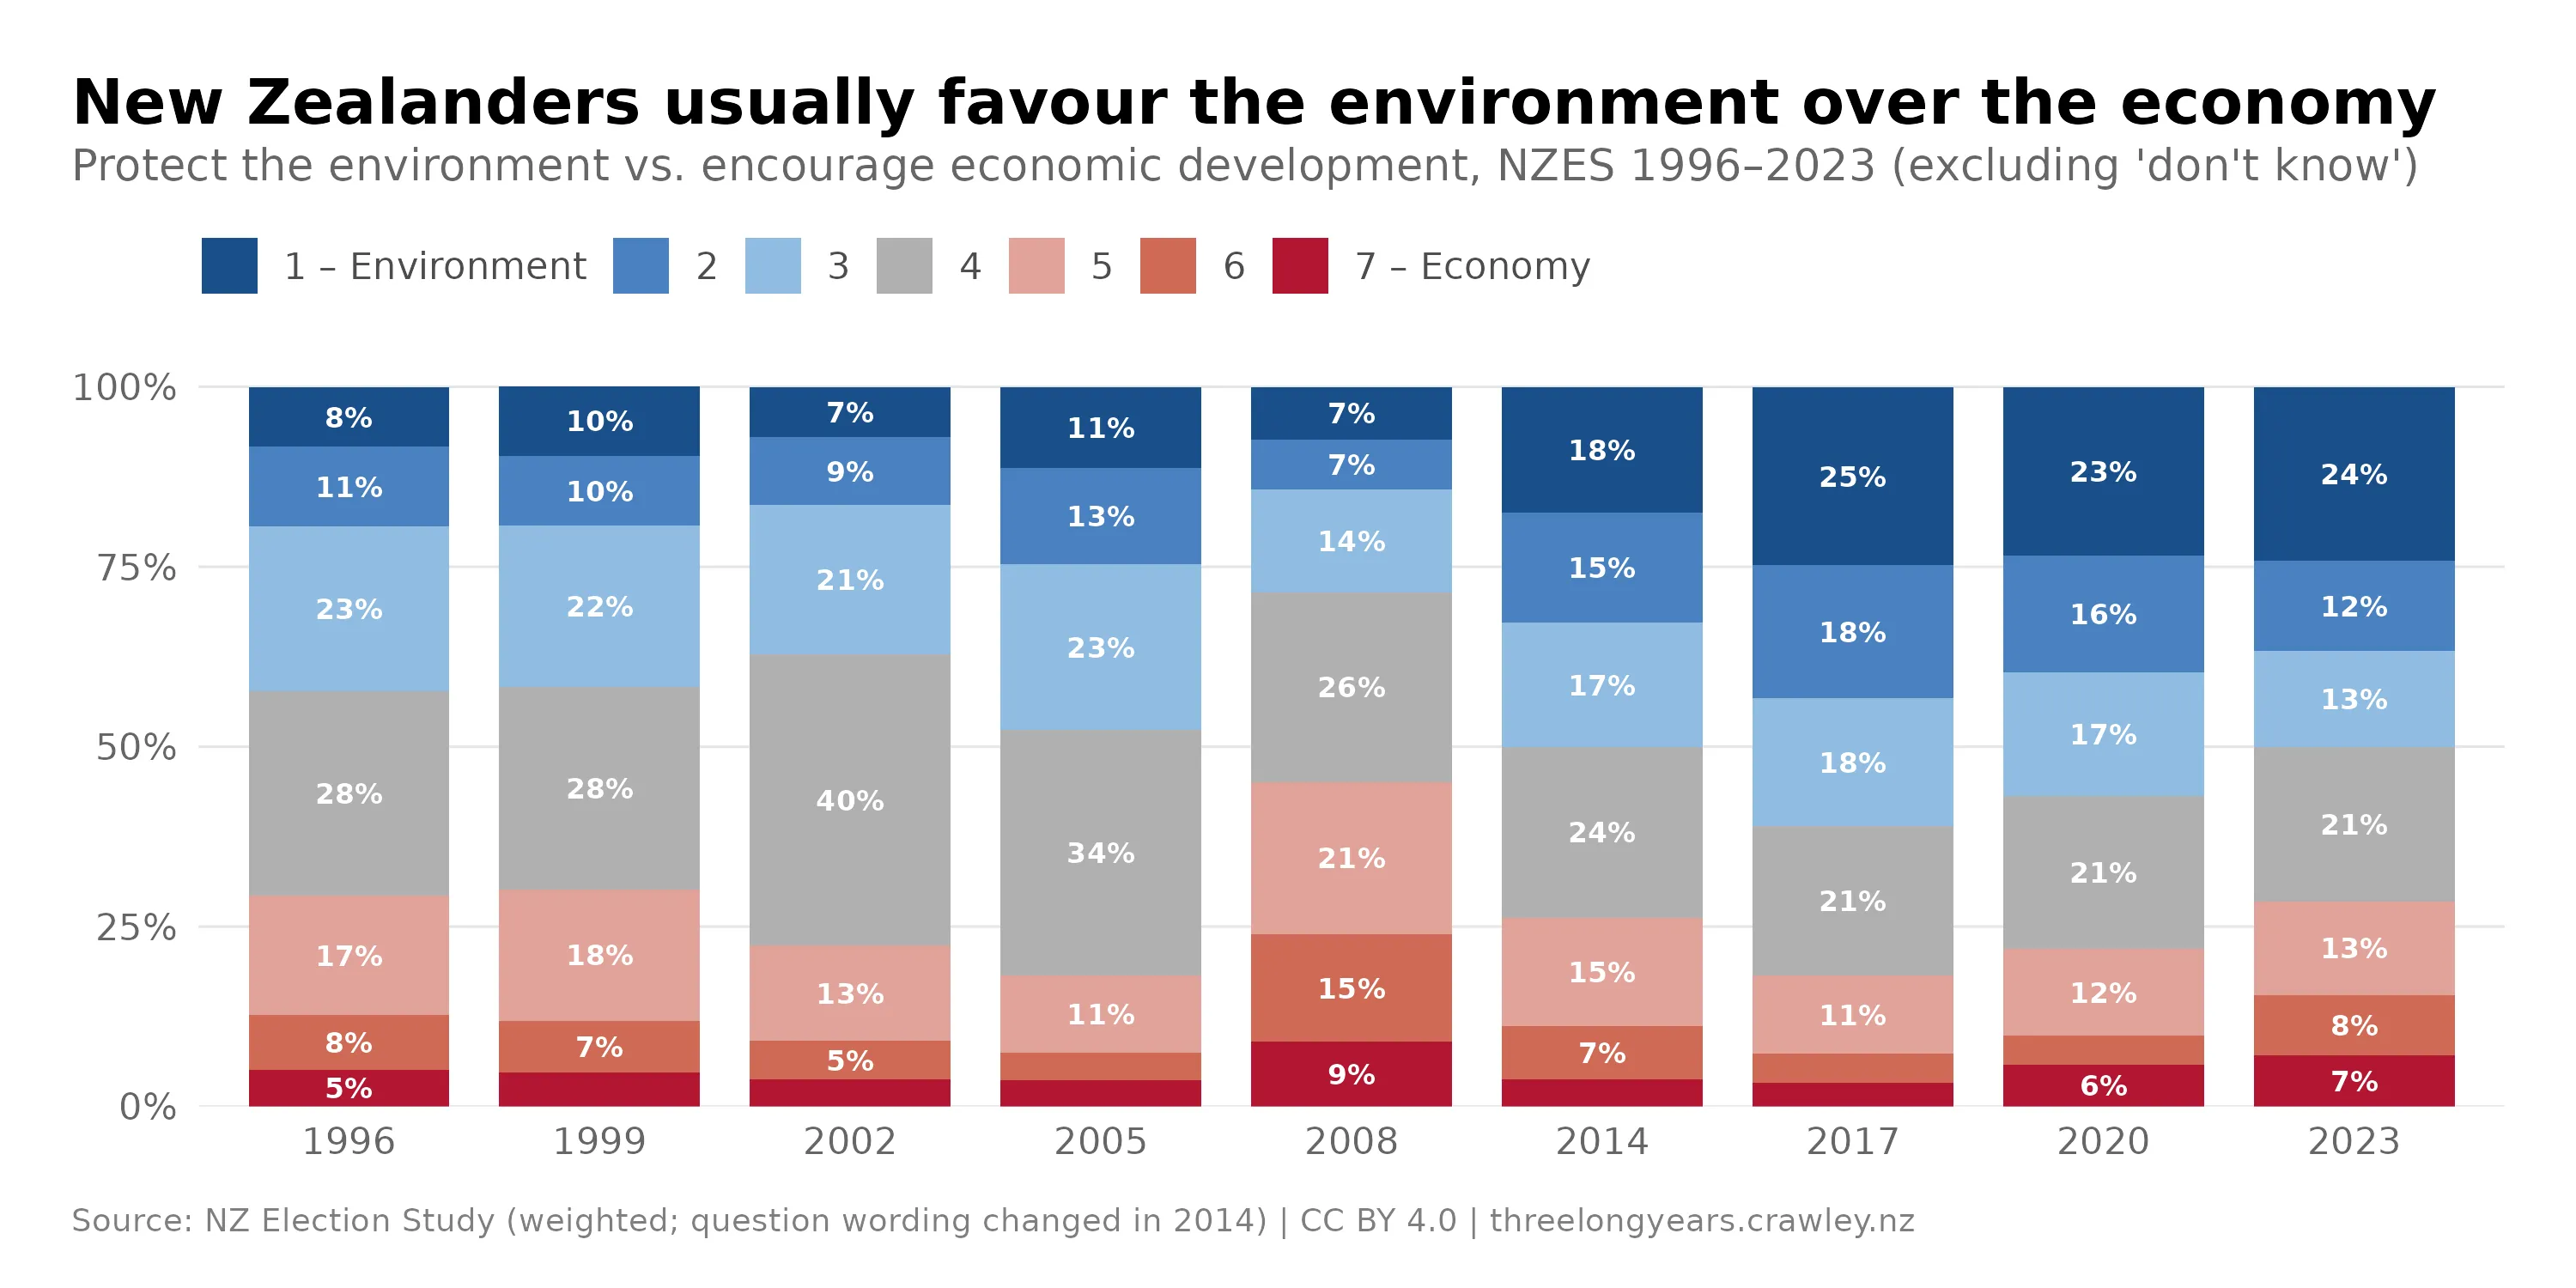
We see a similar pattern when asking people whether they prefer environmental protection over economic development. The exception was 2008 when the Global Financial Crisis was hitting the world, and economic concerns temporarily pushed out the environment.3
Most of the public supports environmental action, and that support seems to be growing over time. But, like so many other issues, the support is not evenly distributed among the public.
Preferred environmental spending over time
Environment vs. economy preference over time
The clear left–right divide
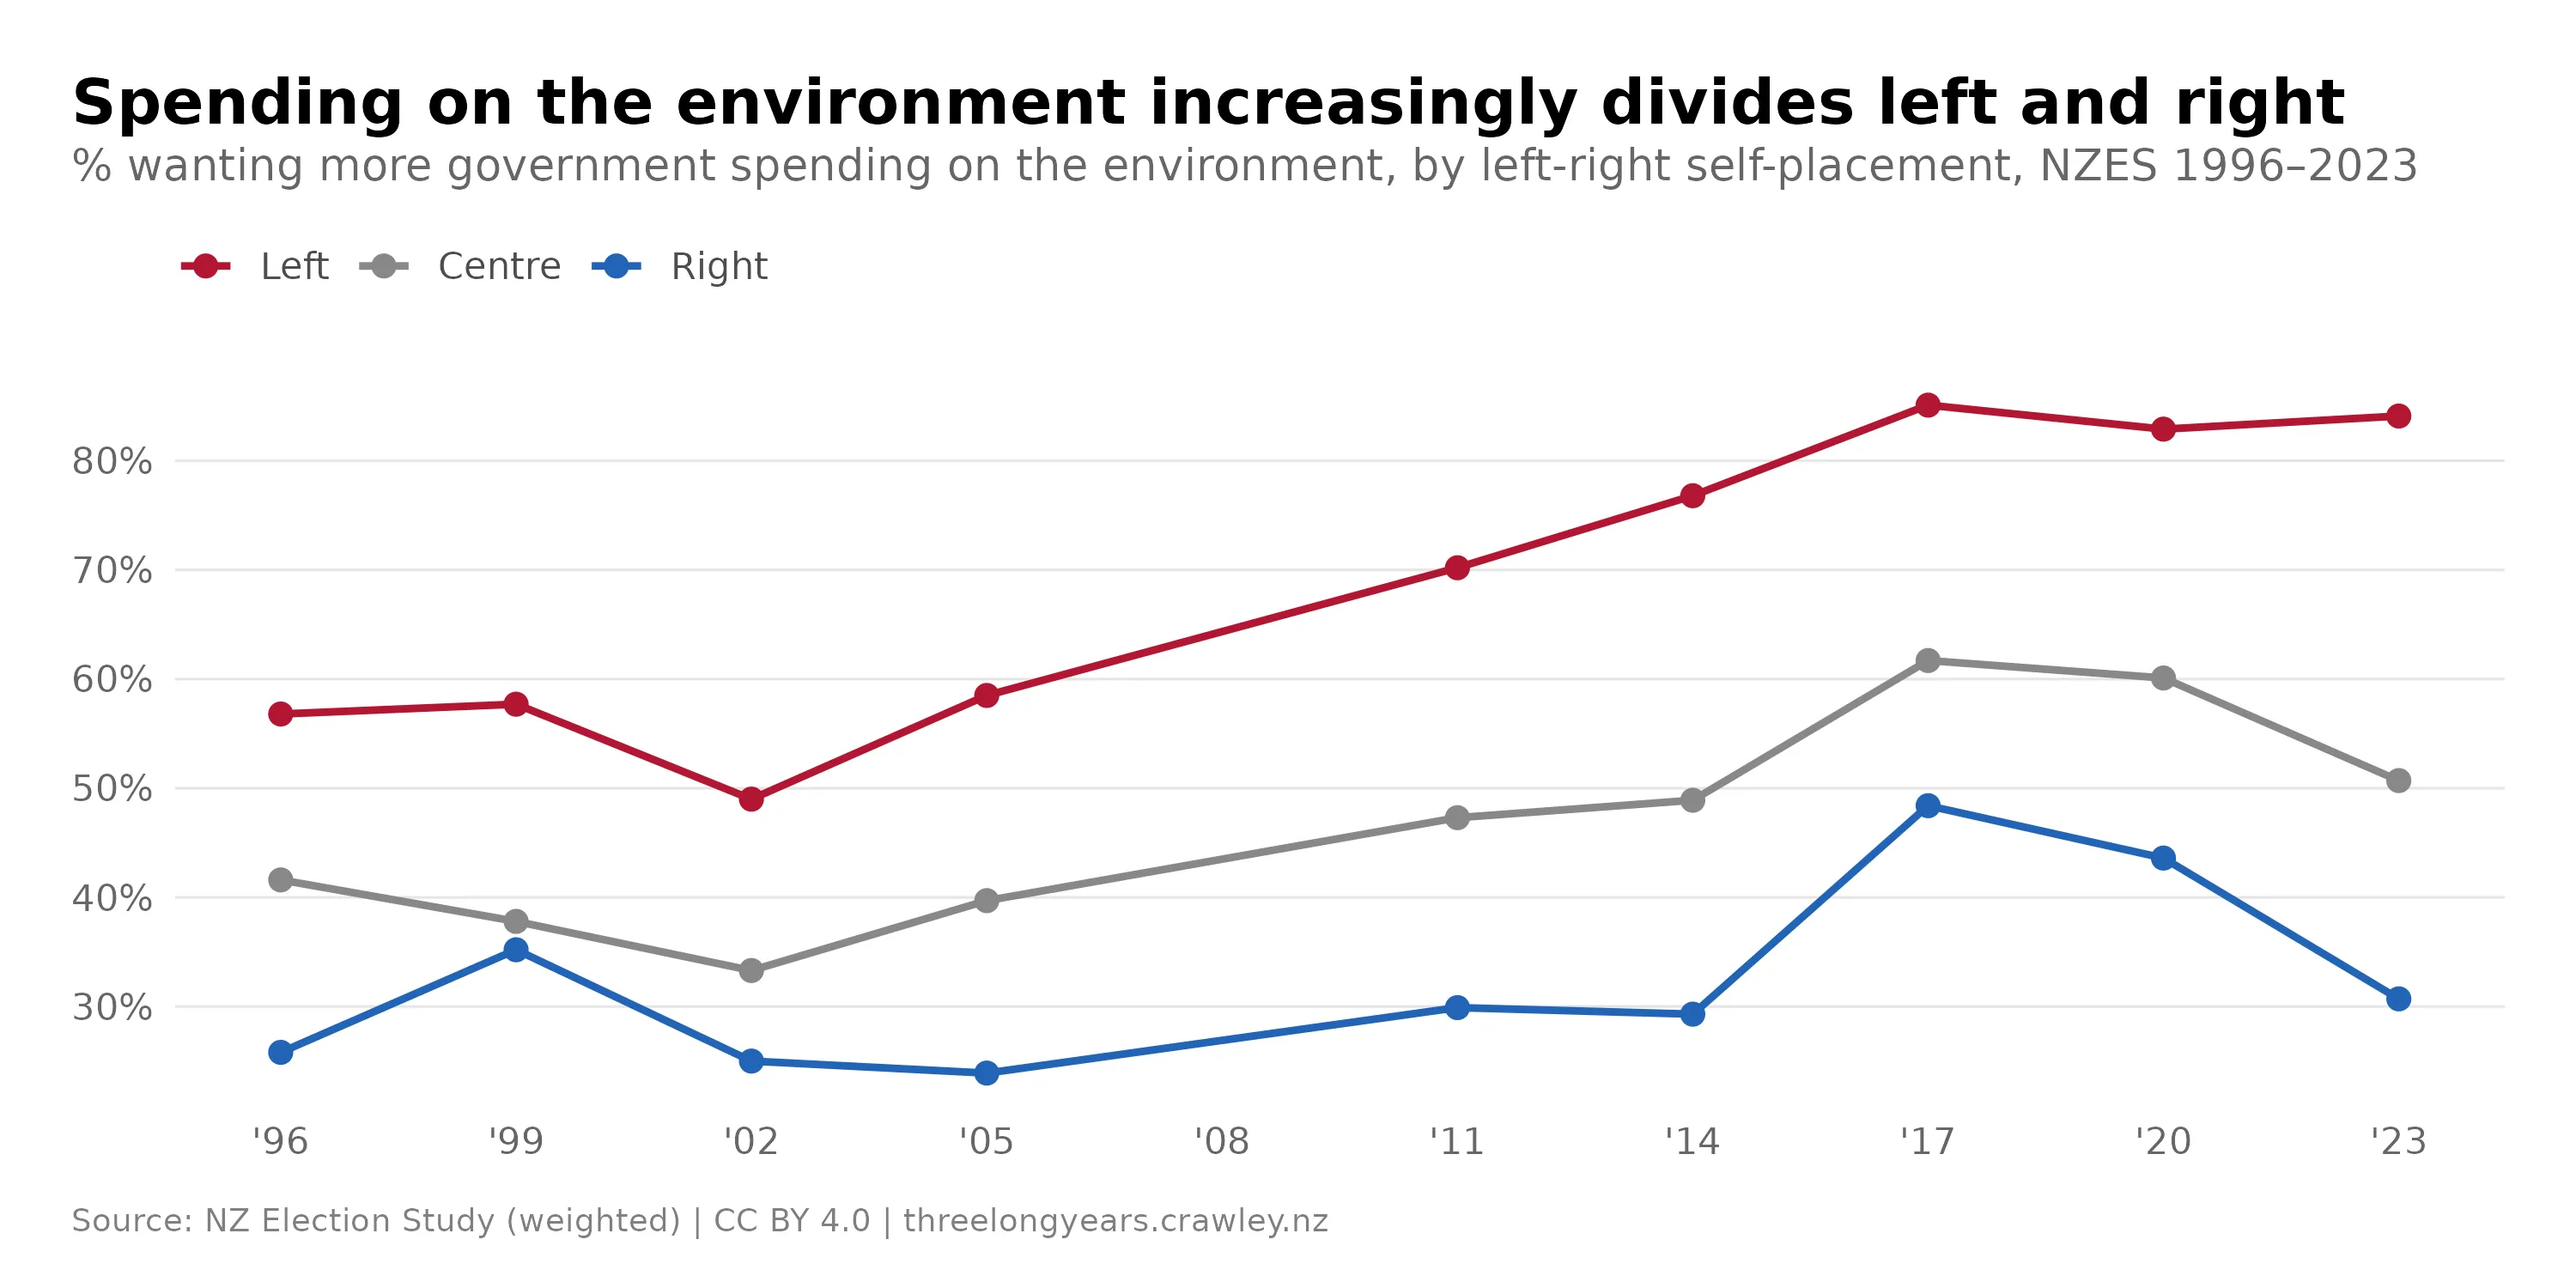
When splitting support for more environmental spending by where people position themselves on the left–right political spectrum, we can see that there is a clear divide. In 2023, over 80% of people on the left wanted more environmental spending, while just over 30% on the right wanted more. This situation mirrors the trend seen in support for climate action.
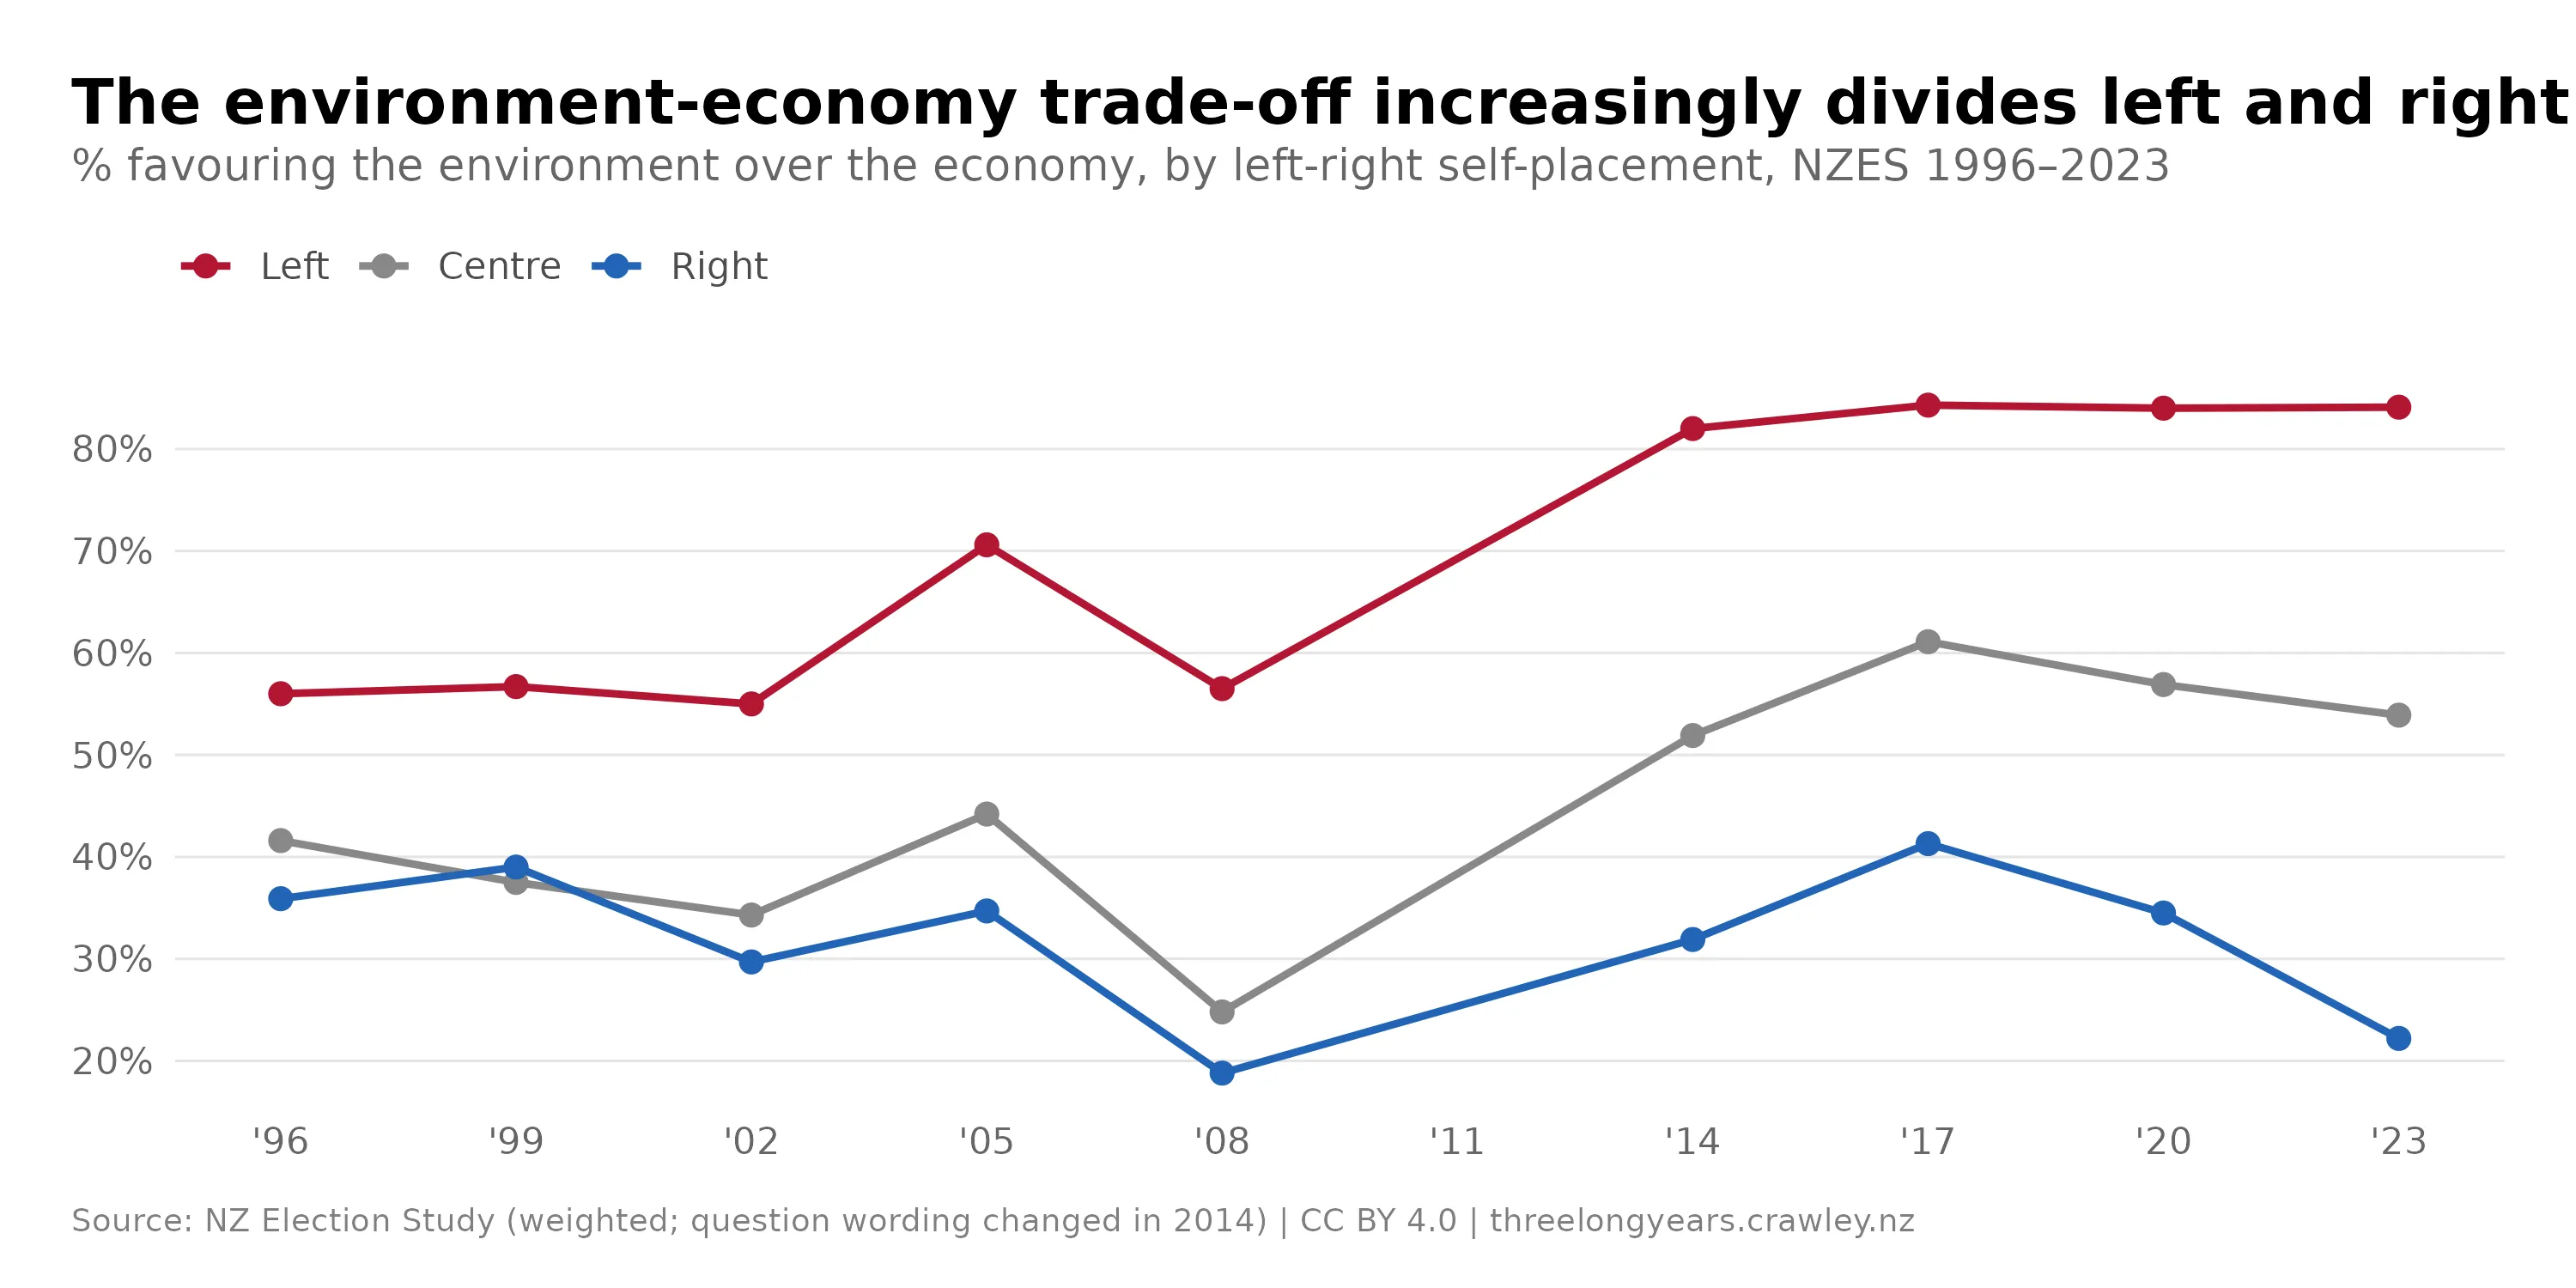
However, the data also shows that in 2017 — at the height of support for environmental spending — close to a majority of right-leaning people wanted more spending. The patterns are very similar when looking at the environment vs economy measure (see supplementary figure).
Environment vs. economy preference by left–right position
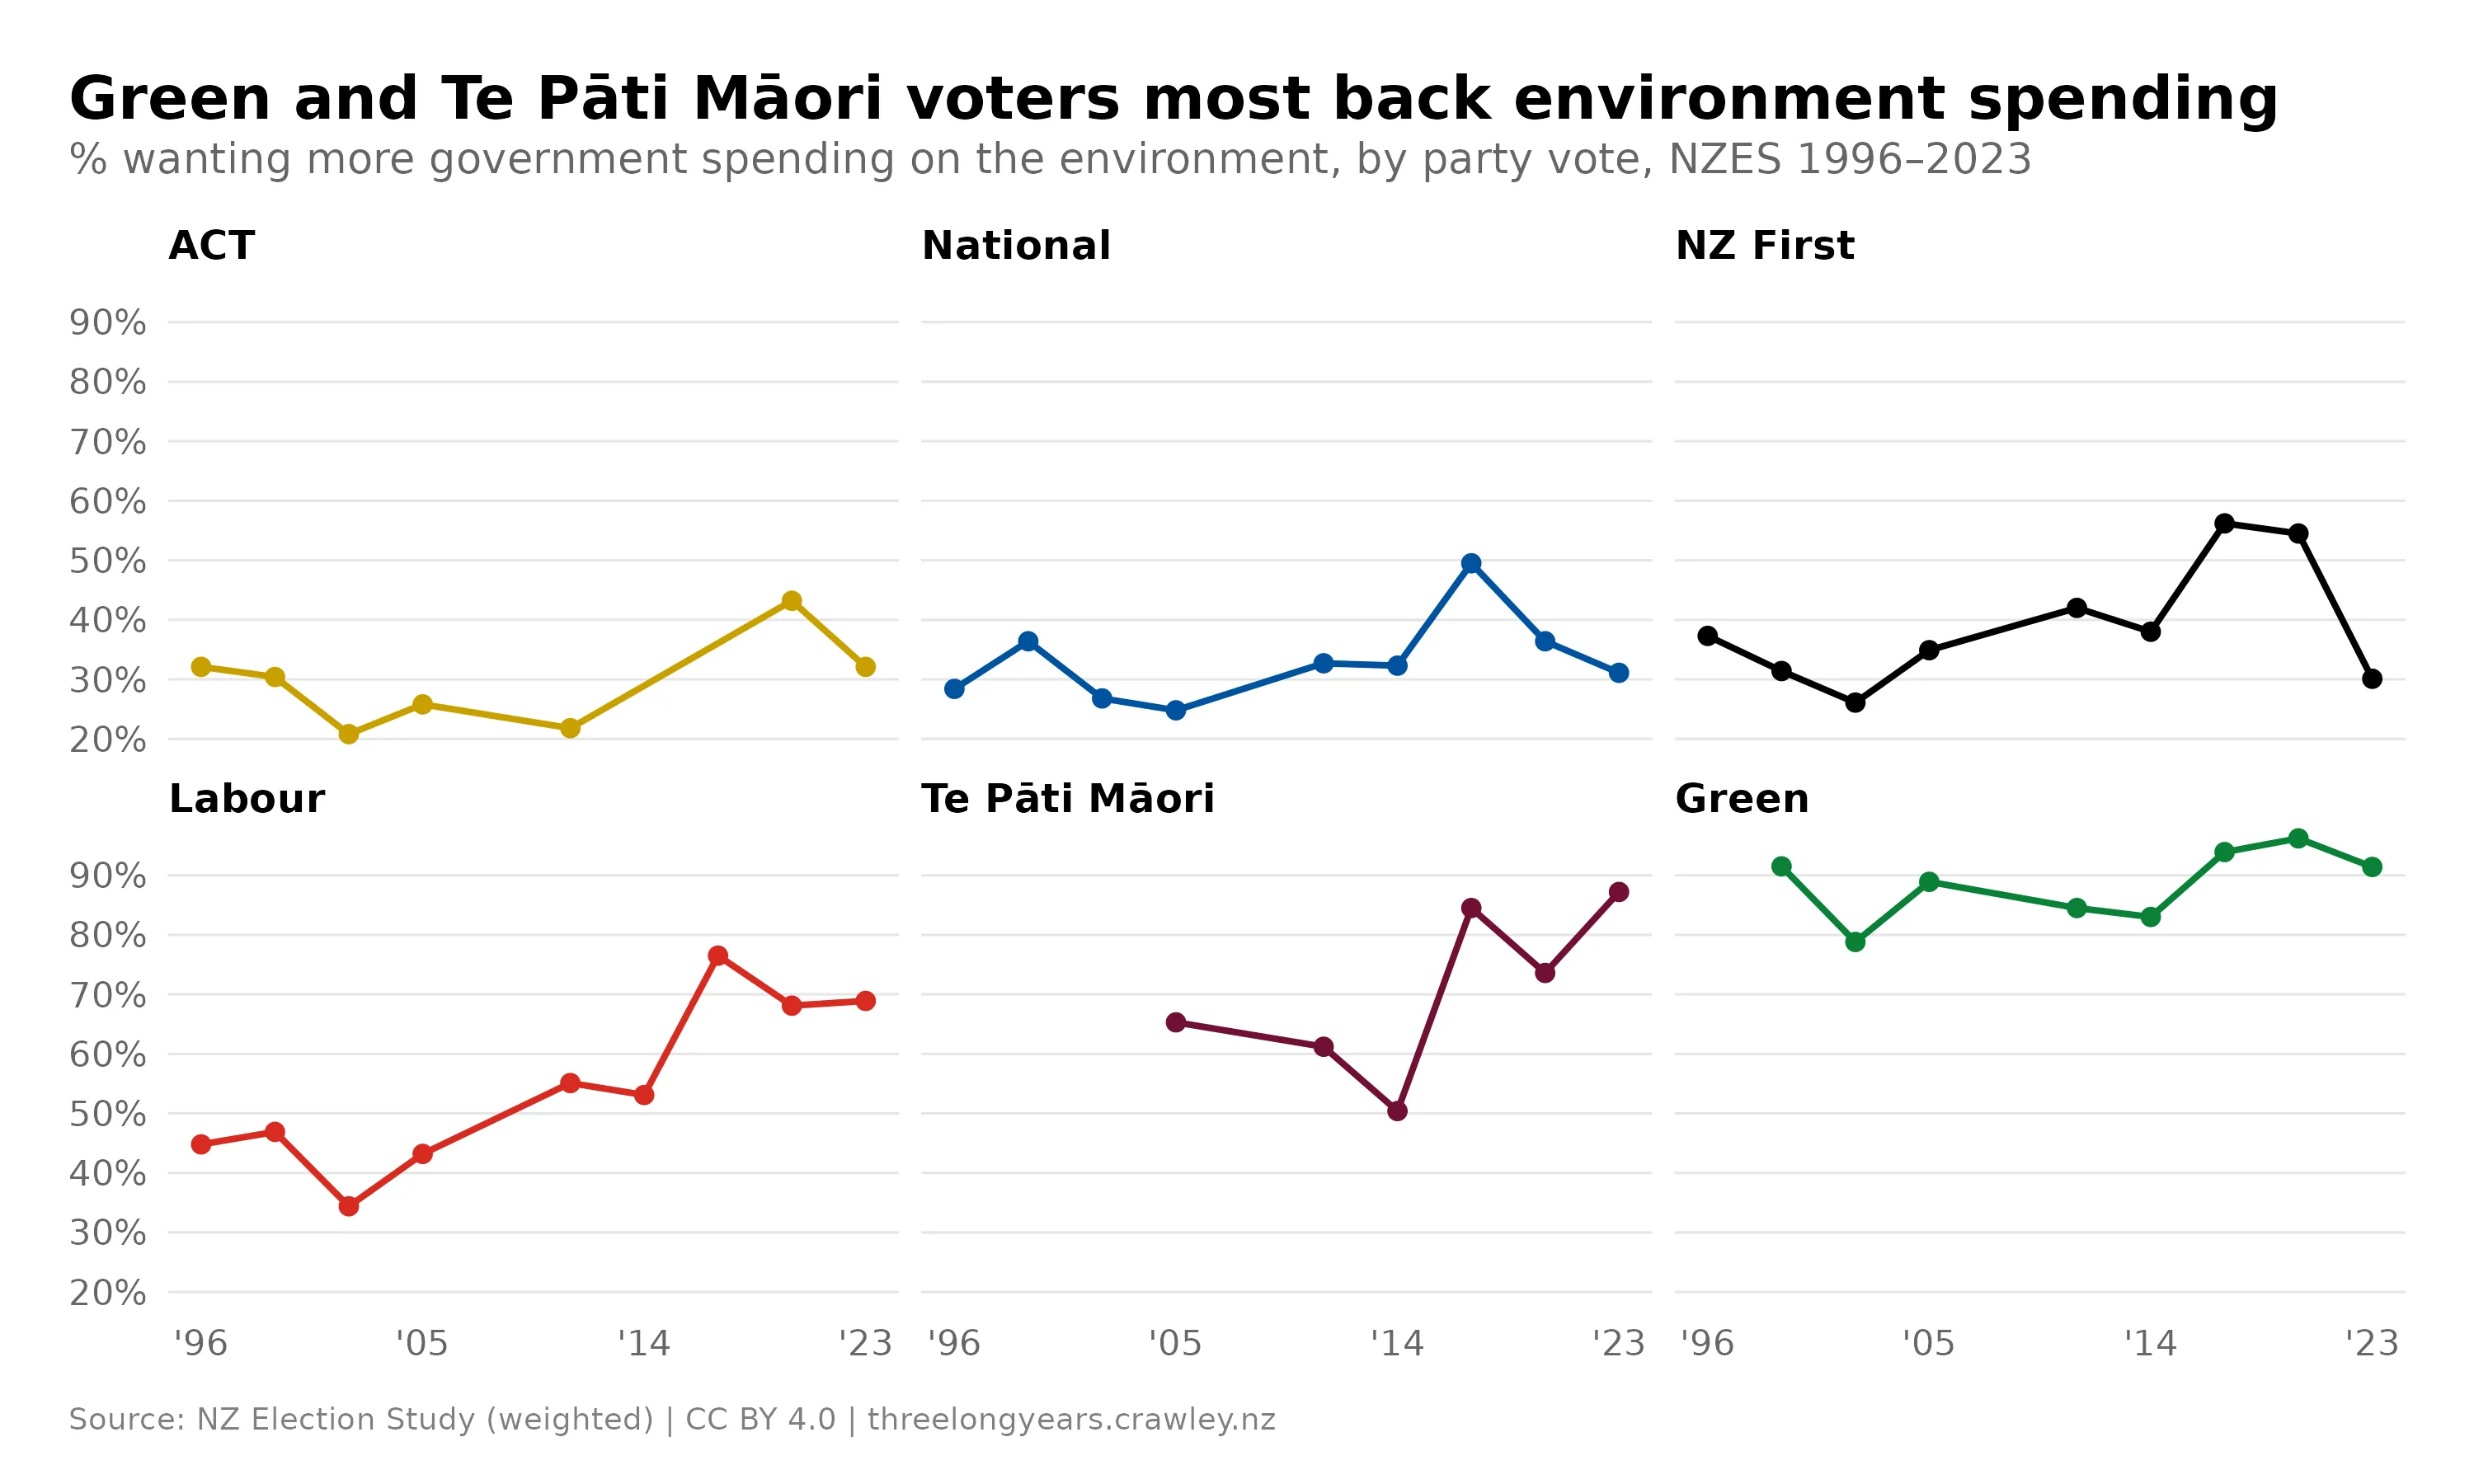
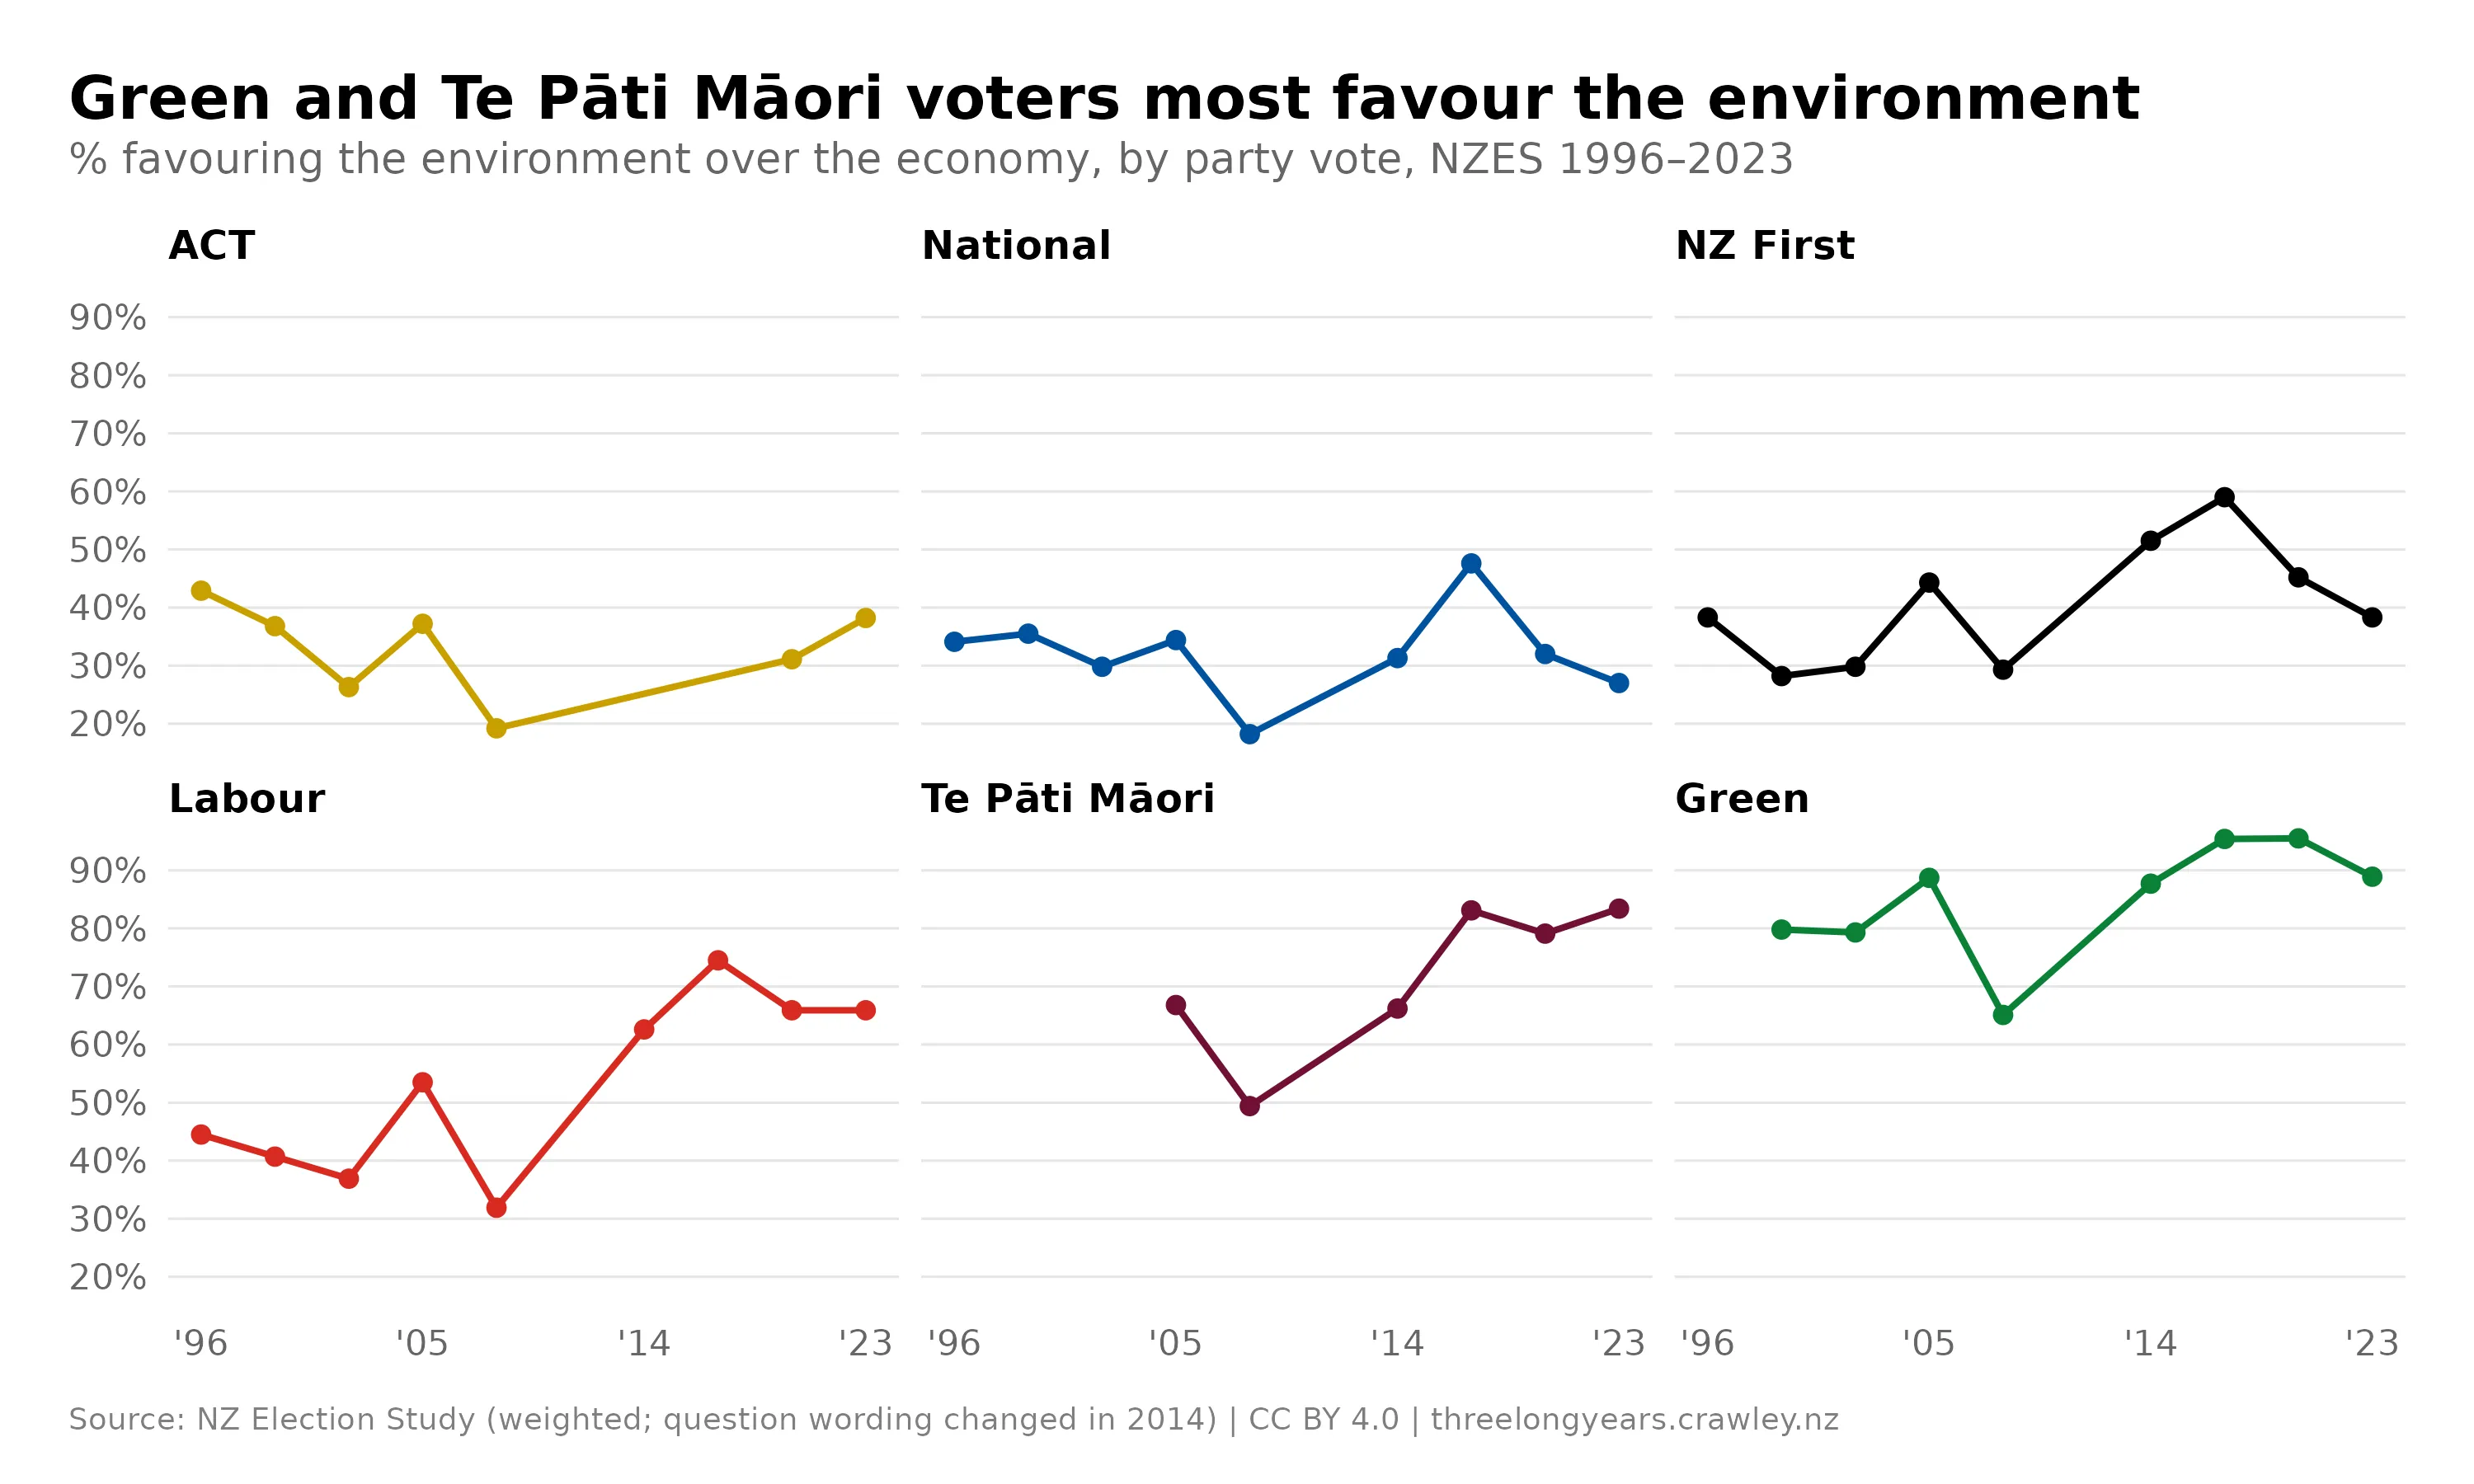
The divide is also clear when looking at support for spending by party. At no point since 1996 have a majority of ACT and National party voters supported increased environmental spending. The environment has become more important for Labour voters over time, and in recent elections, just under 70% want more spending.
Environment vs. economy preference by party
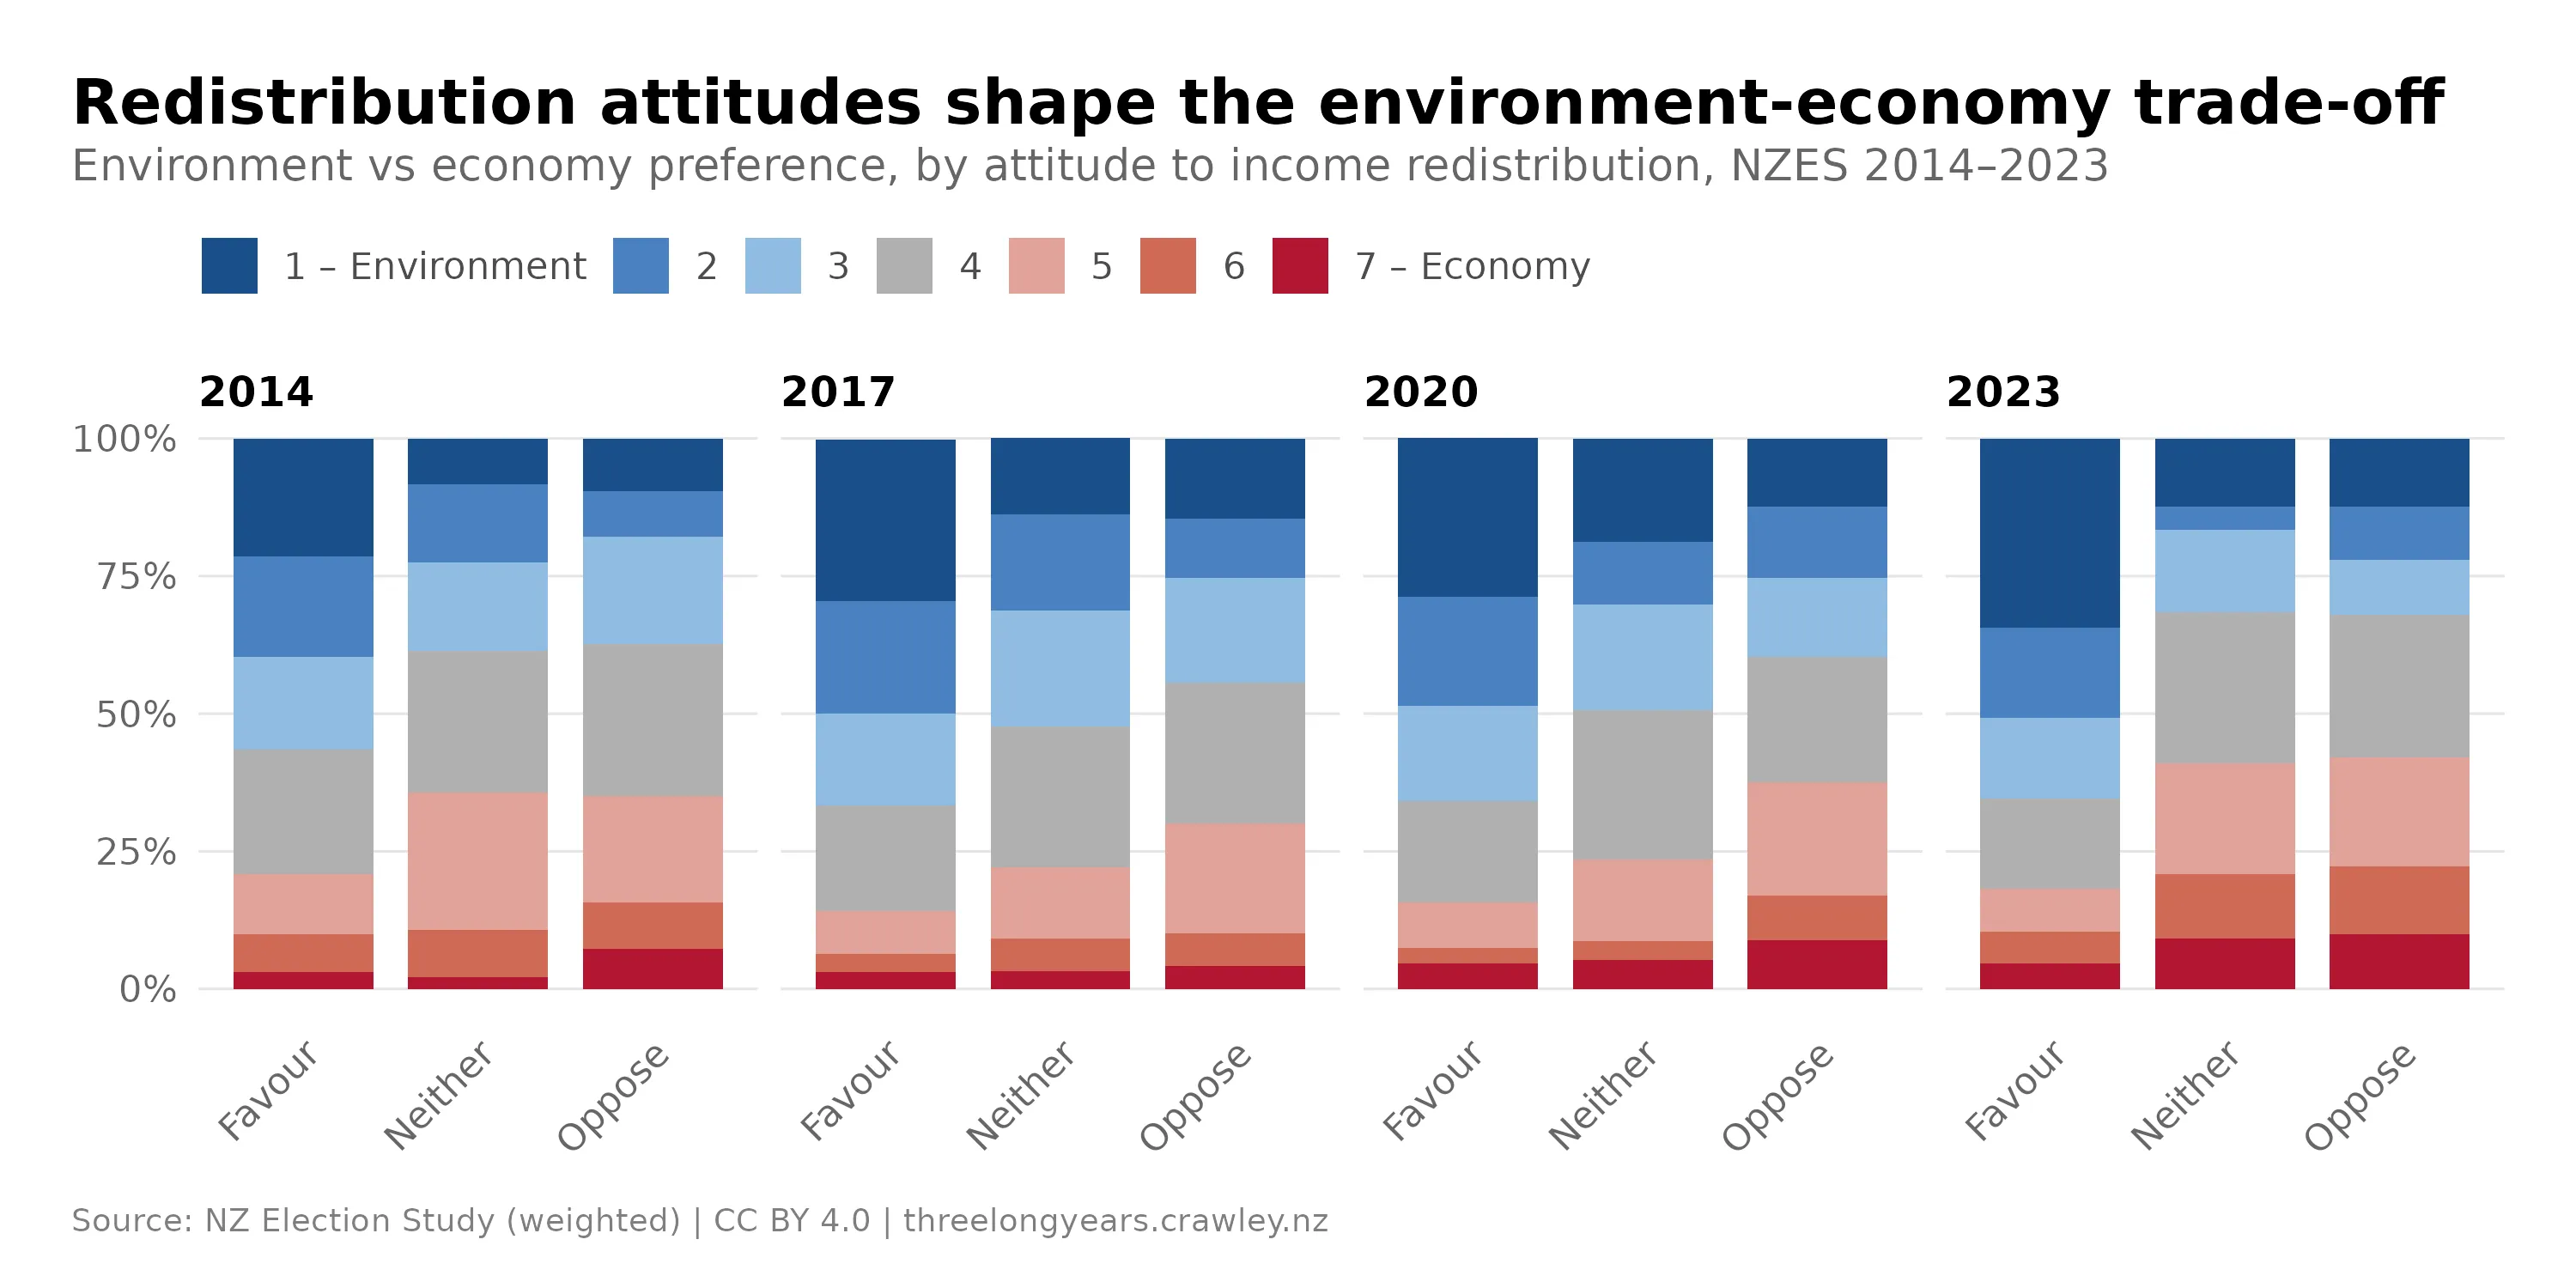
There are similar patterns when splitting people by their support for government measures to reduce income differences. People who favour reductions in income inequality tend also to support higher spending on the environment, which suggests there is a relationship between people’s economic worldview and support for environmental action.
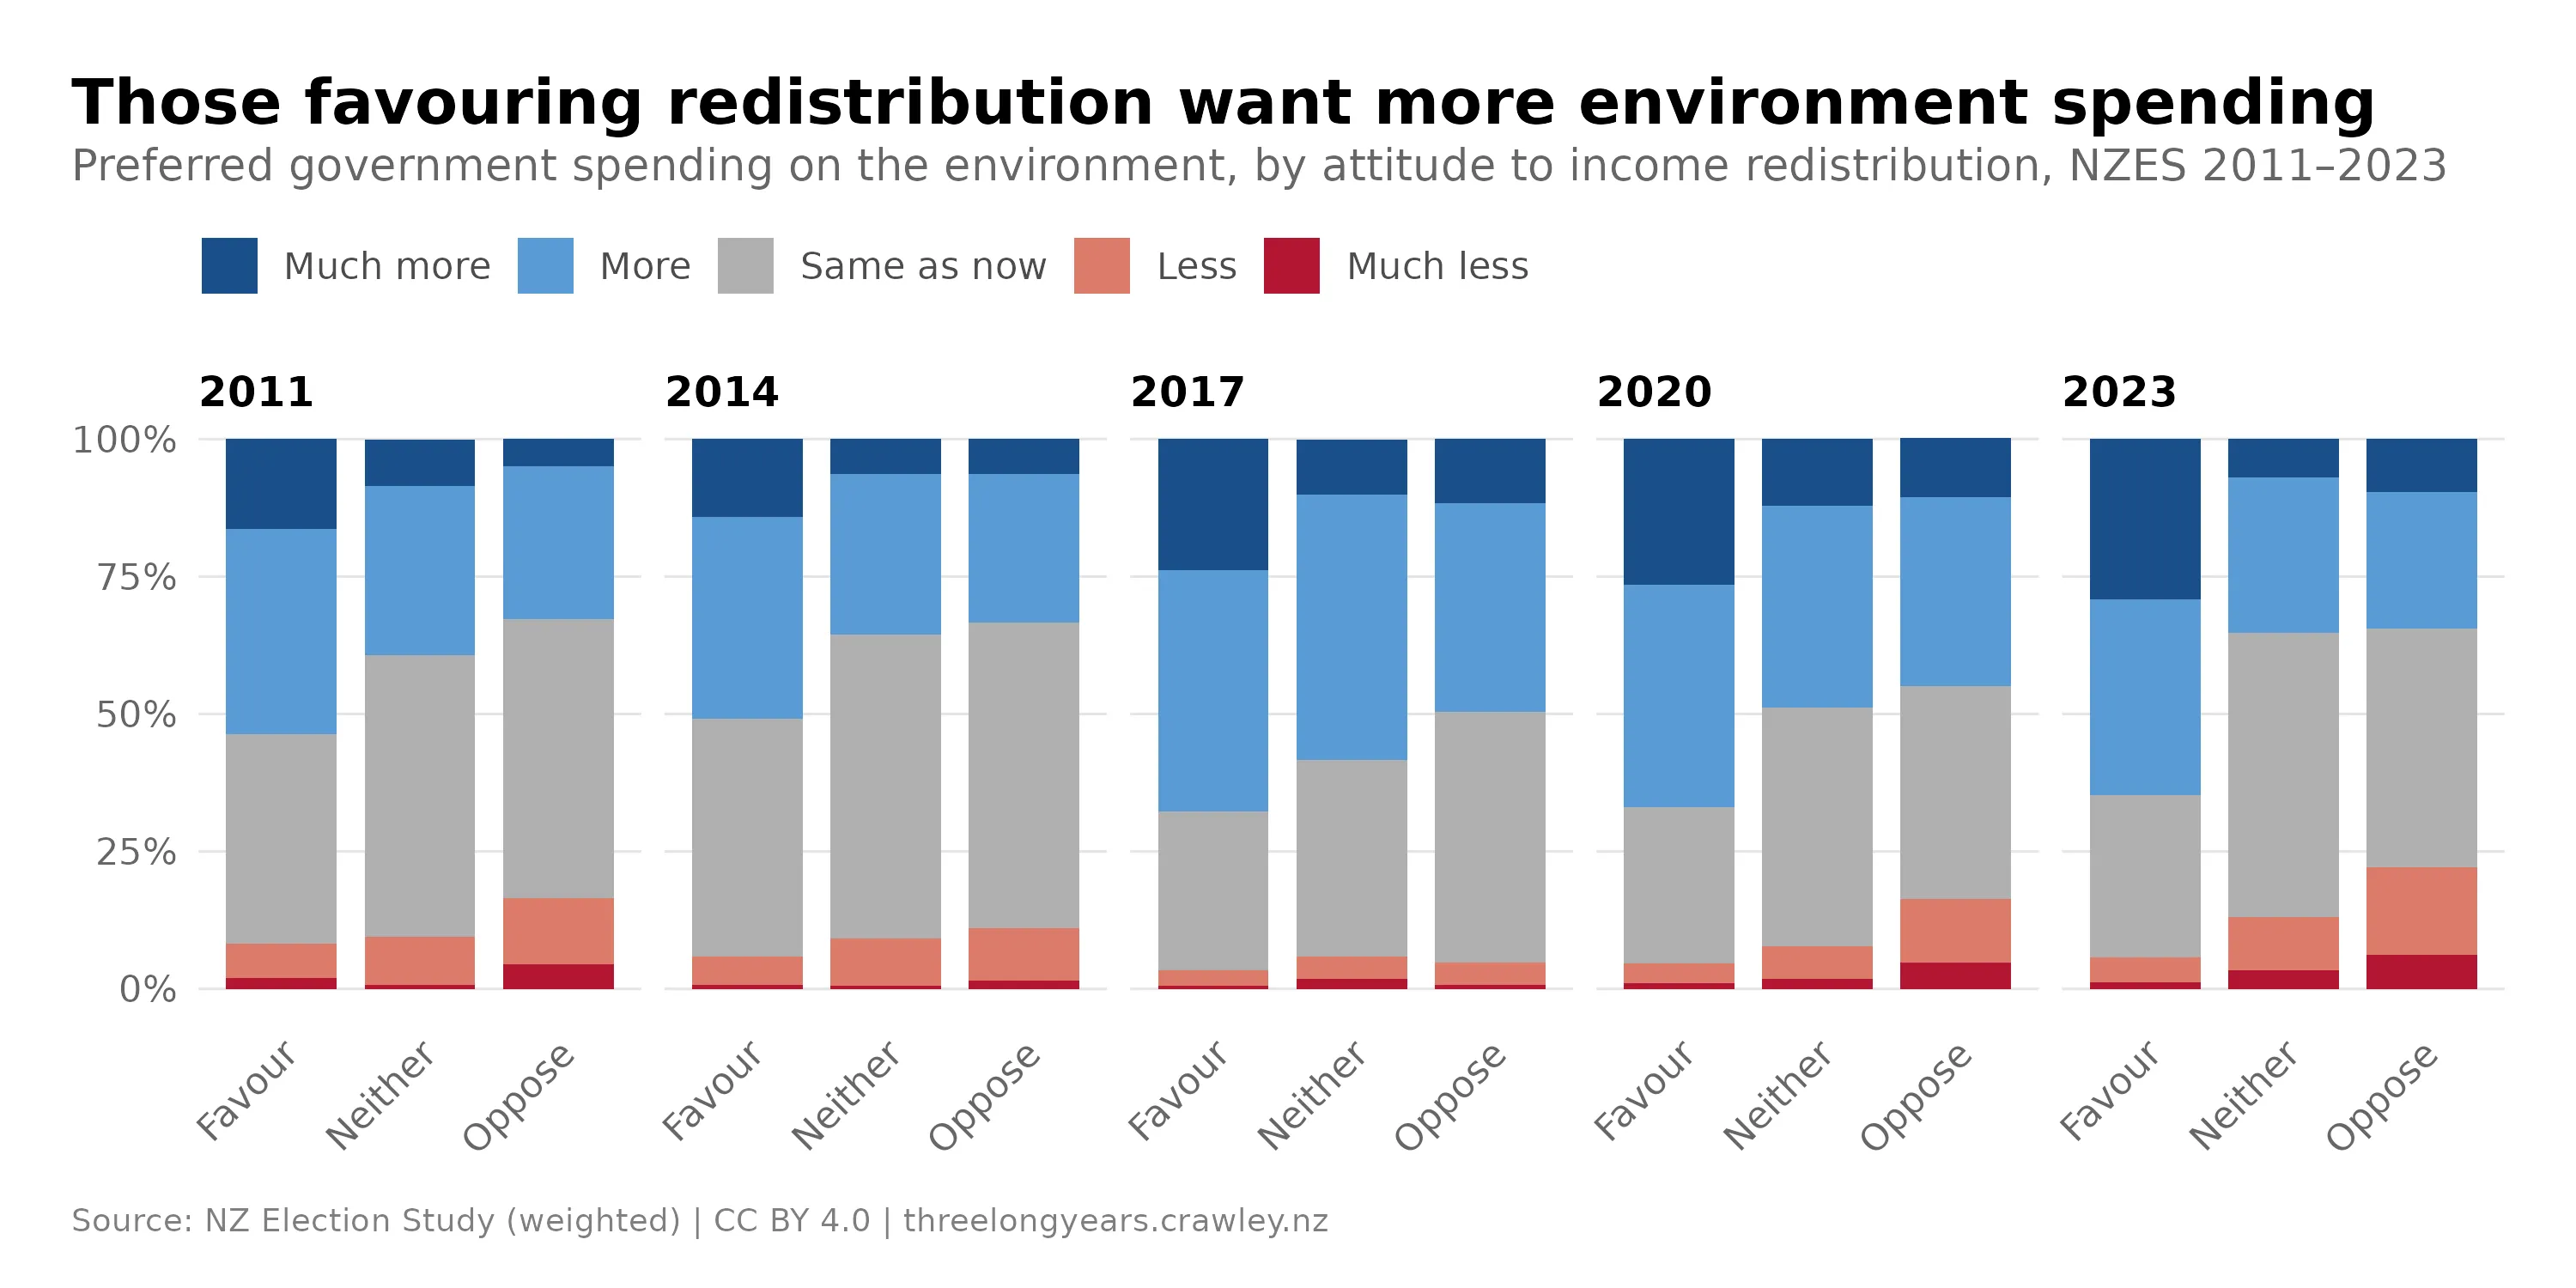
Environment vs. economy preference by support for reducing income differences
Comparing NZ to the world
How does public support for environmental action in NZ compare to the rest of the world? I used International Social Survey Programme (ISSP) 2020 data for the comparative analyses below. NZ has among the highest levels of concern about the environment of the countries included in ISSP, with an average of 4.1, where 5 is “very concerned”.
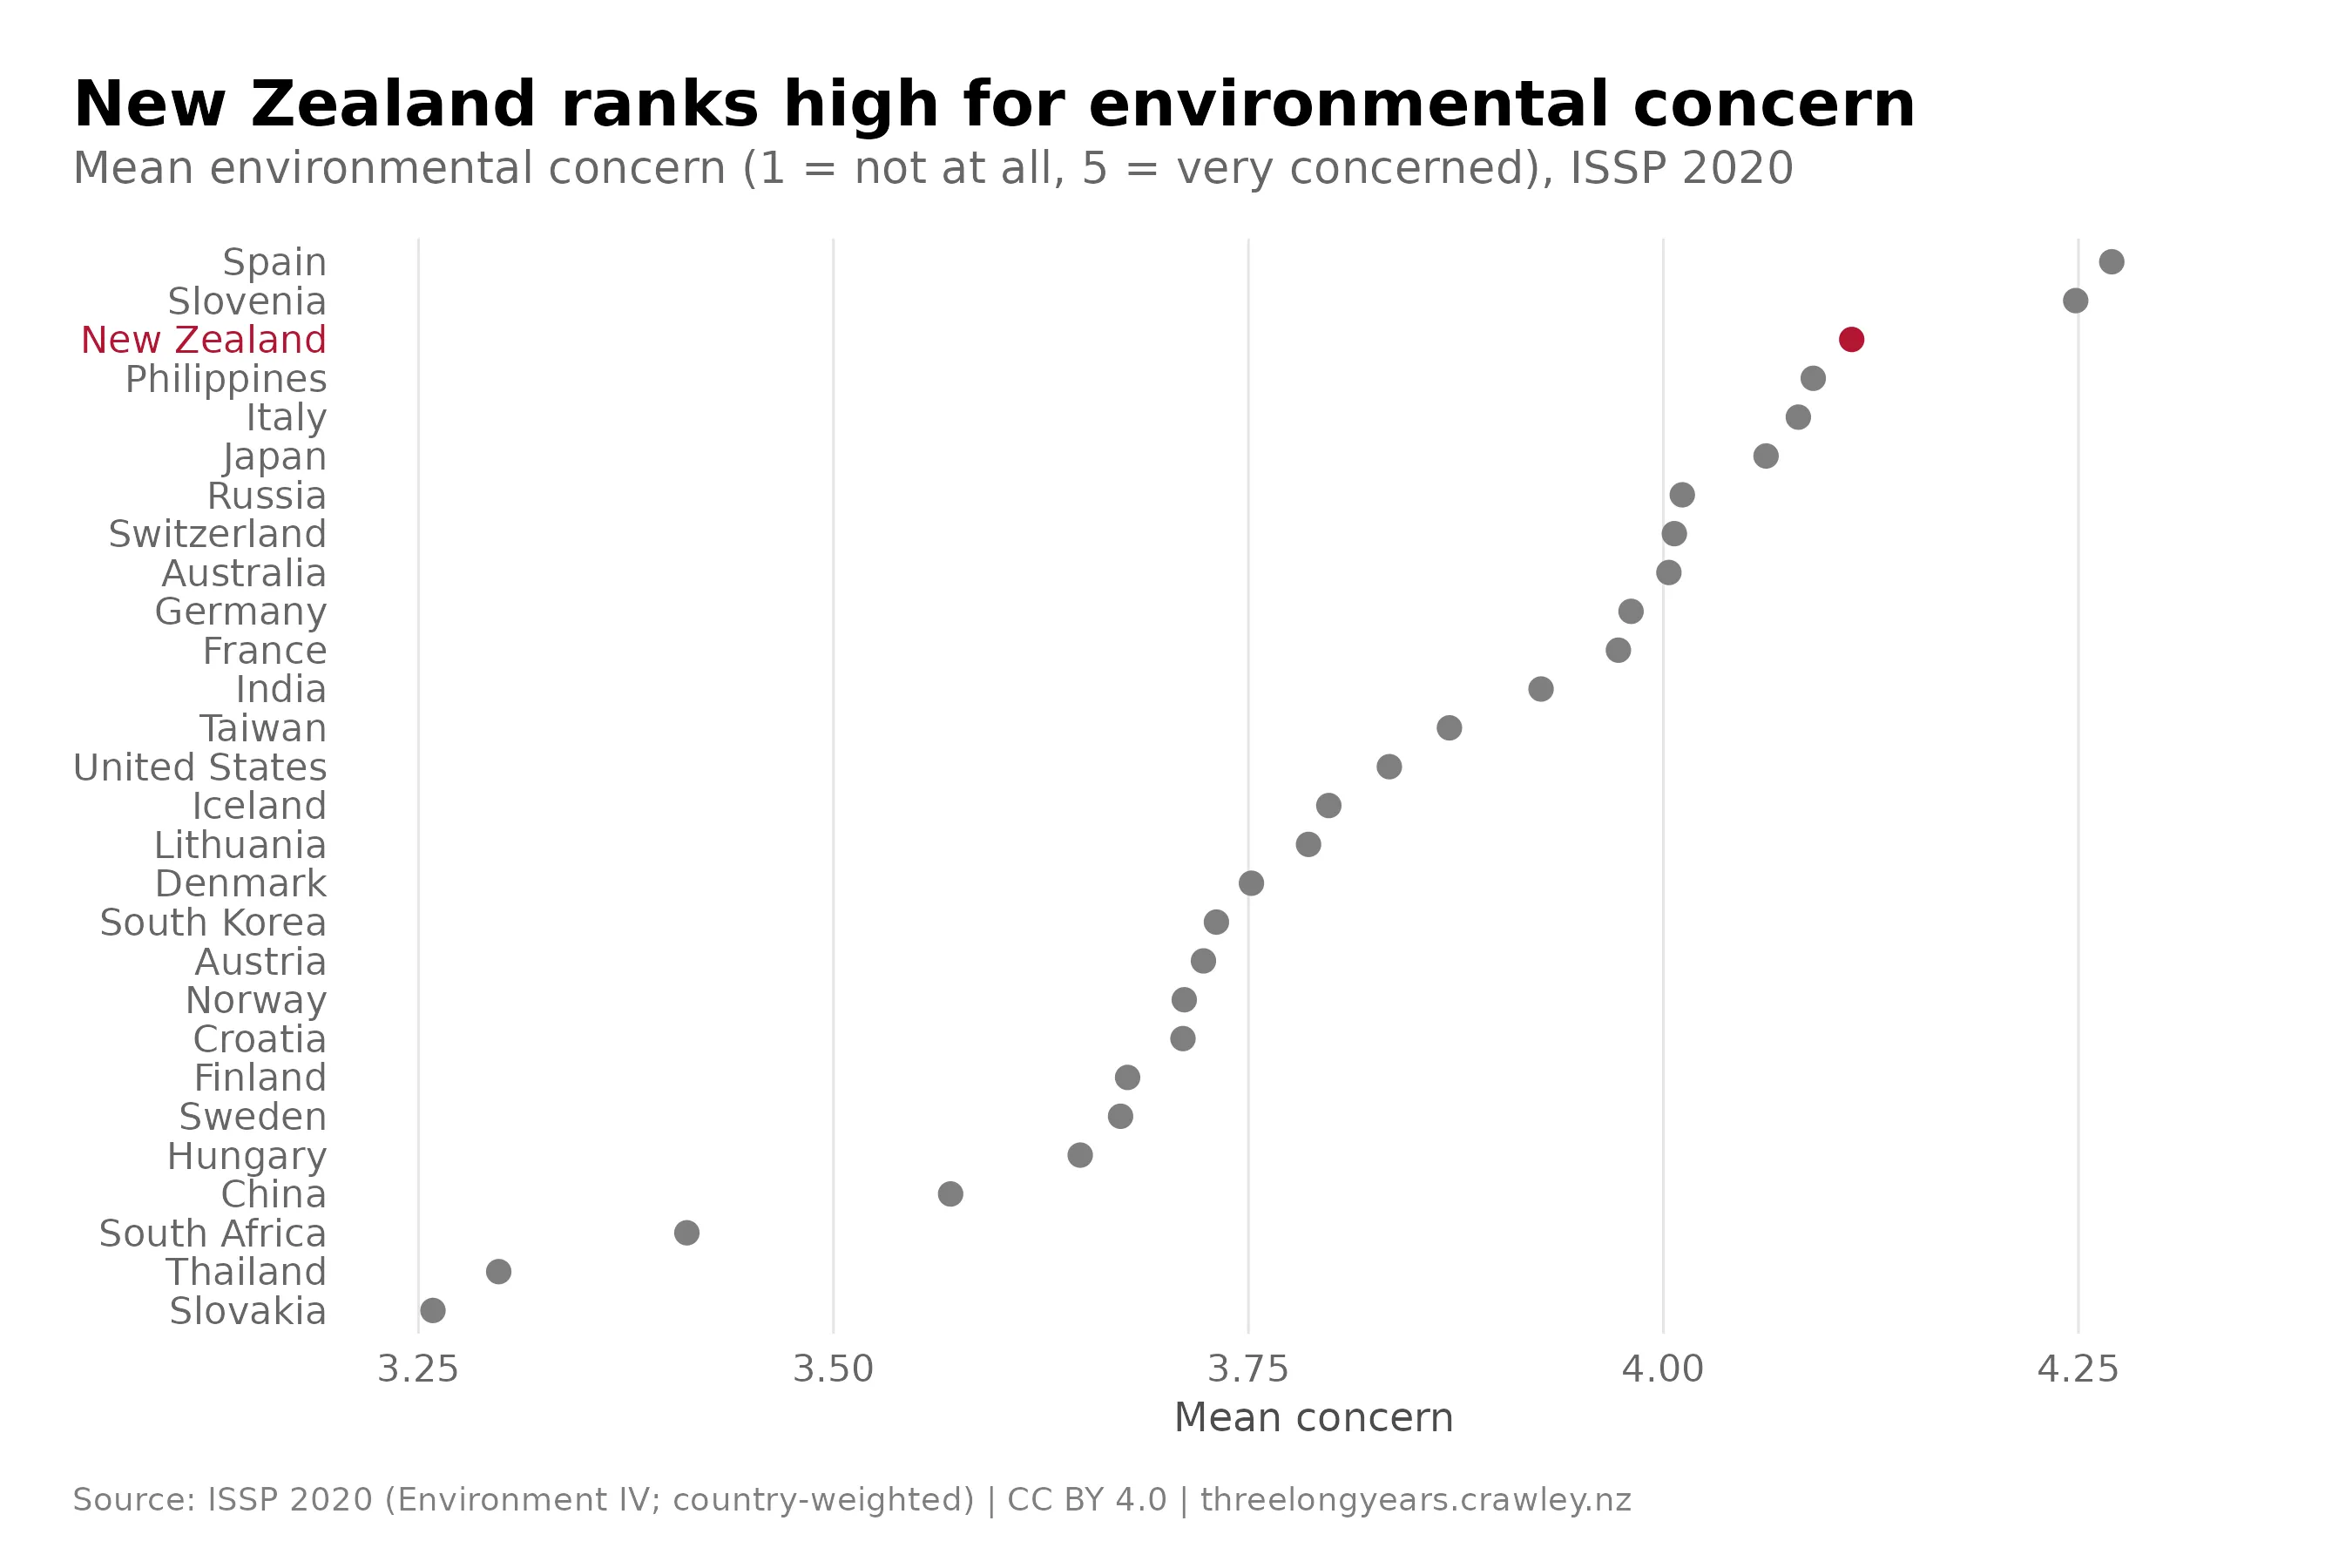
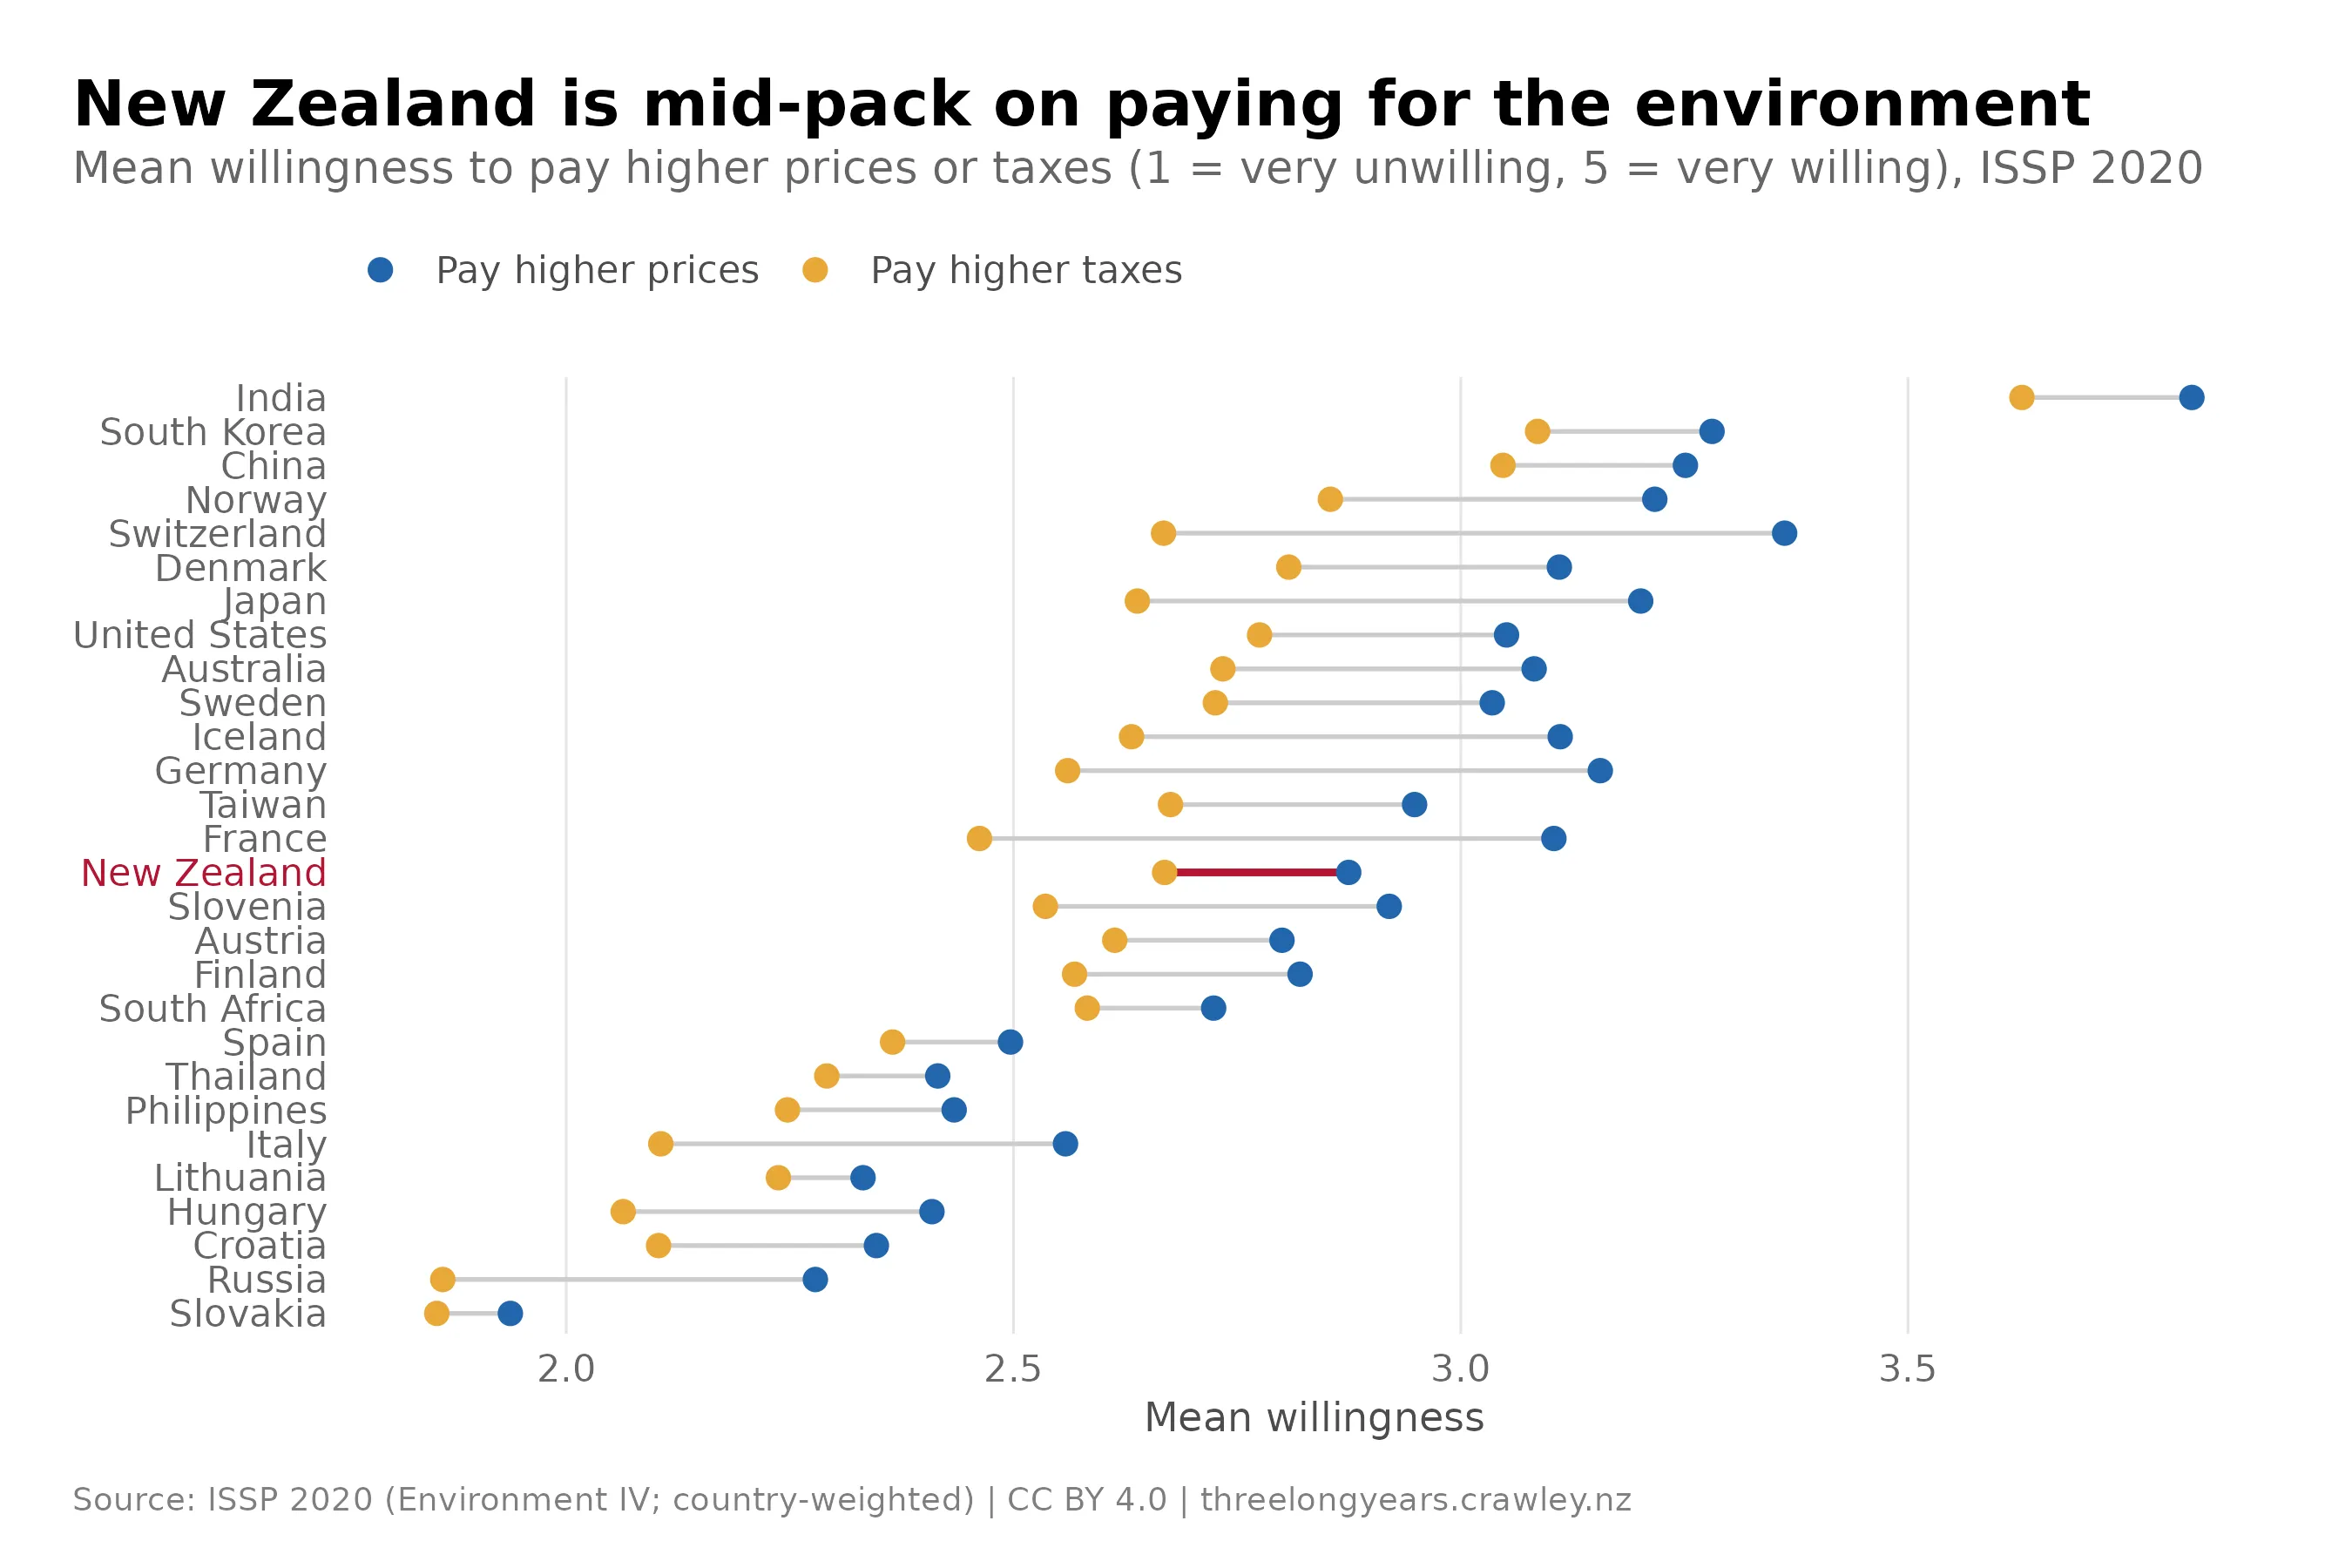
For policy support, however, NZ is closer to the middle of the pack. When asked about willingness to pay higher prices or taxes to address environmental issues, the average in NZ is 2.9 and 2.7 respectively, lower than countries including Denmark, the United States and Australia.
A (narrow) space for a blue-green party?
It’s clear from this data that the environment remains primarily the domain of the political left. Support for increased environmental spending is over 90% among Green voters, and very strong among Te Pāti Māori and Labour voters. In contrast, only minorities of people who support the right-leaning parties want more money spent on the environment.
The results could still imply there is some space for a small blue-green party to occupy. Even at the lowest points of support for environmental action, around a quarter of right-leaning voters have wanted more money spent on the environment — a constituency that’s small but not negligible. In theory, a party that consolidated enough of those voters could cross the 5% threshold and enter parliament.
That said, an alternative reading of the results is that a right-leaning environmental party faces trade-offs that are hard to reconcile. As the ISSP data shows, the NZ public is broadly very concerned about the environment. But when asked about the costs of doing something, people are less supportive of action. Not every environmental intervention requires an economic trade-off, but many do — the current debate over selling conservation land is a prime example.
A blue-green party is therefore, in my view, likely to struggle to consolidate support, no matter how well-run the party may be. It would face challenges equivalent to a left-wing party that did not care much about the environment, and would be unlikely to ever enter parliament. For the foreseeable future, at least, advancement of environmental policy is likely to come primarily from the left.
Footnotes
-
The Opportunities Party occupies some of the “blue-green” space. They have generally strong environmental policies, and some centrist economic and fiscal policies. However, they also have many left-leaning economic policies (such as universal basic income), and therefore are hard to place on a traditional political spectrum. The environment is also not their main focus, so I don’t consider them a blue-green party (whereas Sustainable New Zealand clearly was). ↩
-
This question was not asked in the 2008 NZES. ↩
-
The wording of this question changed in 2014. Previously it had asked if we should prioritise the environment over safeguarding our income. This is, arguably, a harder choice so may have resulted in lower levels of environmental support relative to the later question (which asks about encouraging economic development). ↩
The analysis code for this post is available on Codeberg.
View code on Codeberg →