New Zealand's immigration attitudes: an international outlier

A significant proportion of the New Zealand population want immigration numbers reduced. But there are a variety of reasons why someone might want to see fewer people entering the country. It could be mainly about economic concerns — the idea that more people in the country will mean fewer jobs and houses to go around. Or it could be on cultural grounds — the belief that too many immigrants might change the culture of the country, especially if they come from very different societies.
The reasons why people oppose immigration matter. Economic concerns are probably more easily allayed — if the economy grows, and the cost of living is not a struggle for most people, fears about immigration are likely to subside.
But cultural opposition to immigration tends to be more deep-seated. If people are strongly opposed to immigrants, and if they are particularly opposed to people arriving from certain countries, it creates fertile ground for far-right parties to capitalise on and amplify anti-immigrant sentiment. In some cases, this may lead to xenophobic and racist rhetoric.
In this post, I investigate how much the anti-immigration attitudes that I detailed in my previous post are about the economy or culture. I draw on data from the NZ Election Study (NZES) and the International Social Survey Programme (ISSP), and compare NZ to 28 other countries — finding that anti-immigration sentiment here is lower than in almost all of them.
Economic indicators
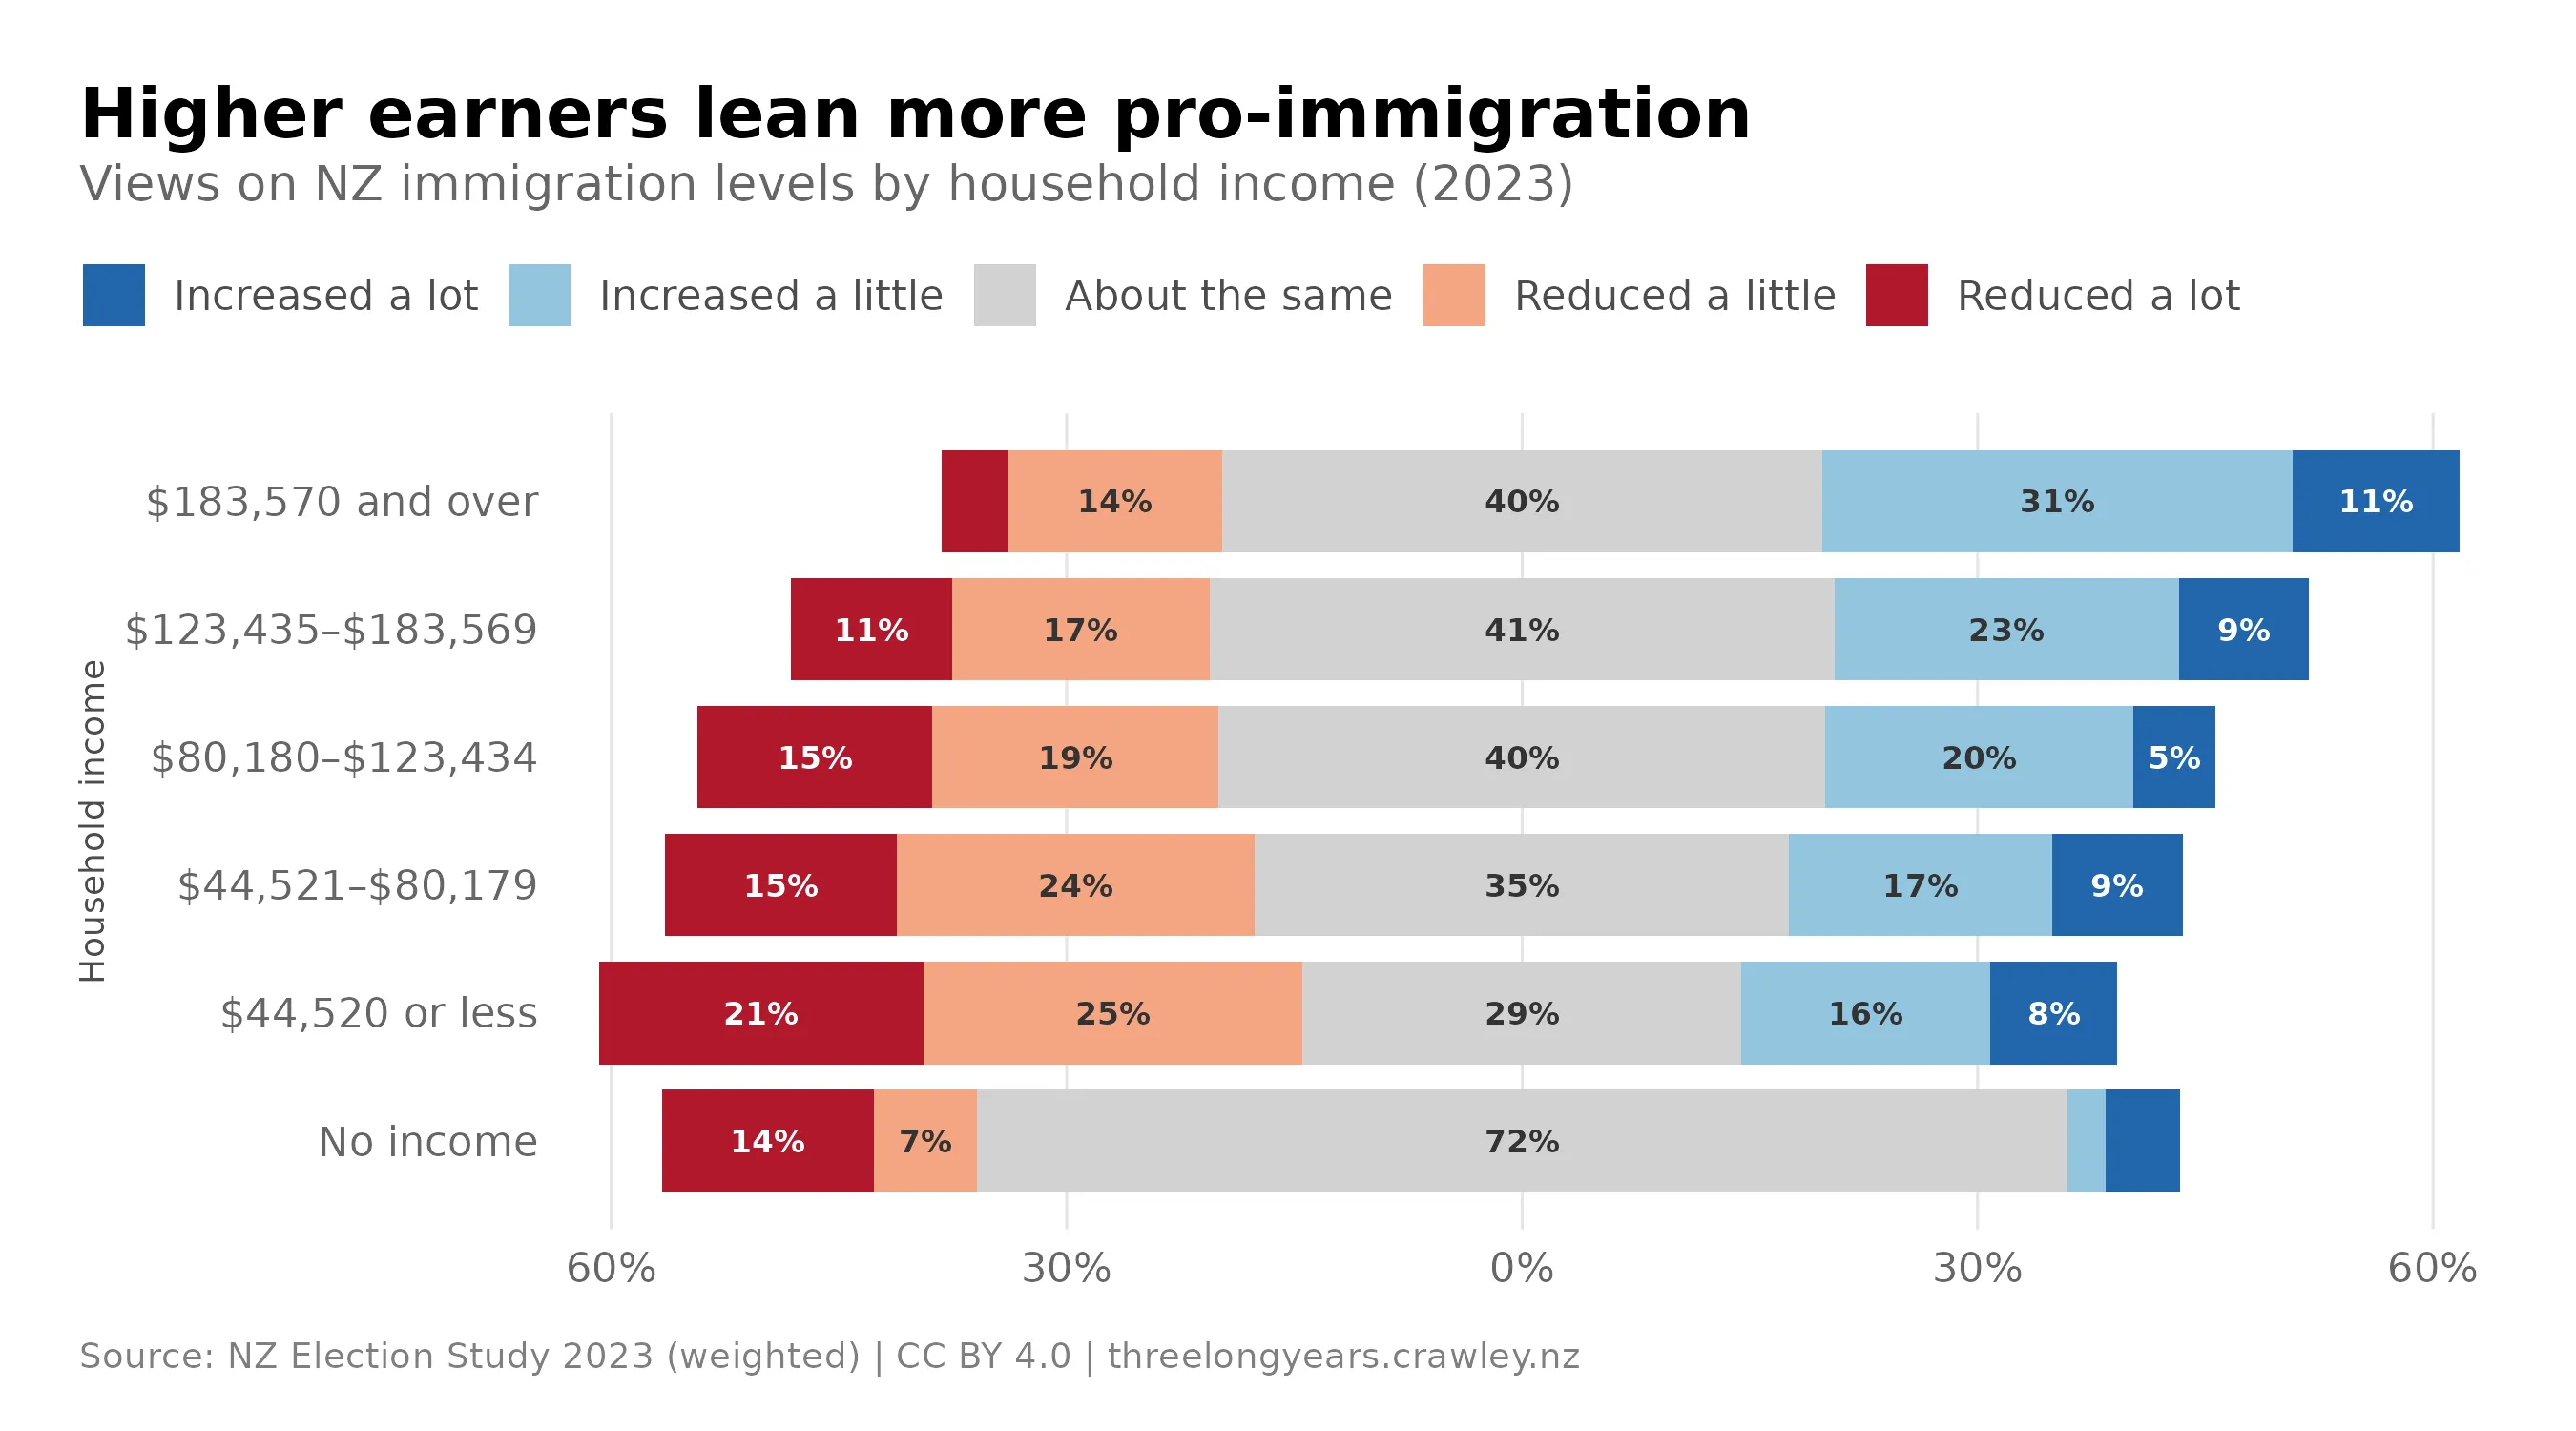
The analyses below are based on the same NZES question as last time, which asks people whether they would like the number of immigrants to NZ reduced or increased. Historically, a high proportion (often a majority) of Kiwis have said they would like to see it reduced, although opposition dipped in 2023 after the pandemic.
When we look at responses to that question by income level we see a clear pattern: the higher a person’s household income, the lower their level of opposition to immigration.1 The top two brackets both lean pro-immigration on average, while in the lowest bracket nearly half (46%) want immigration reduced.
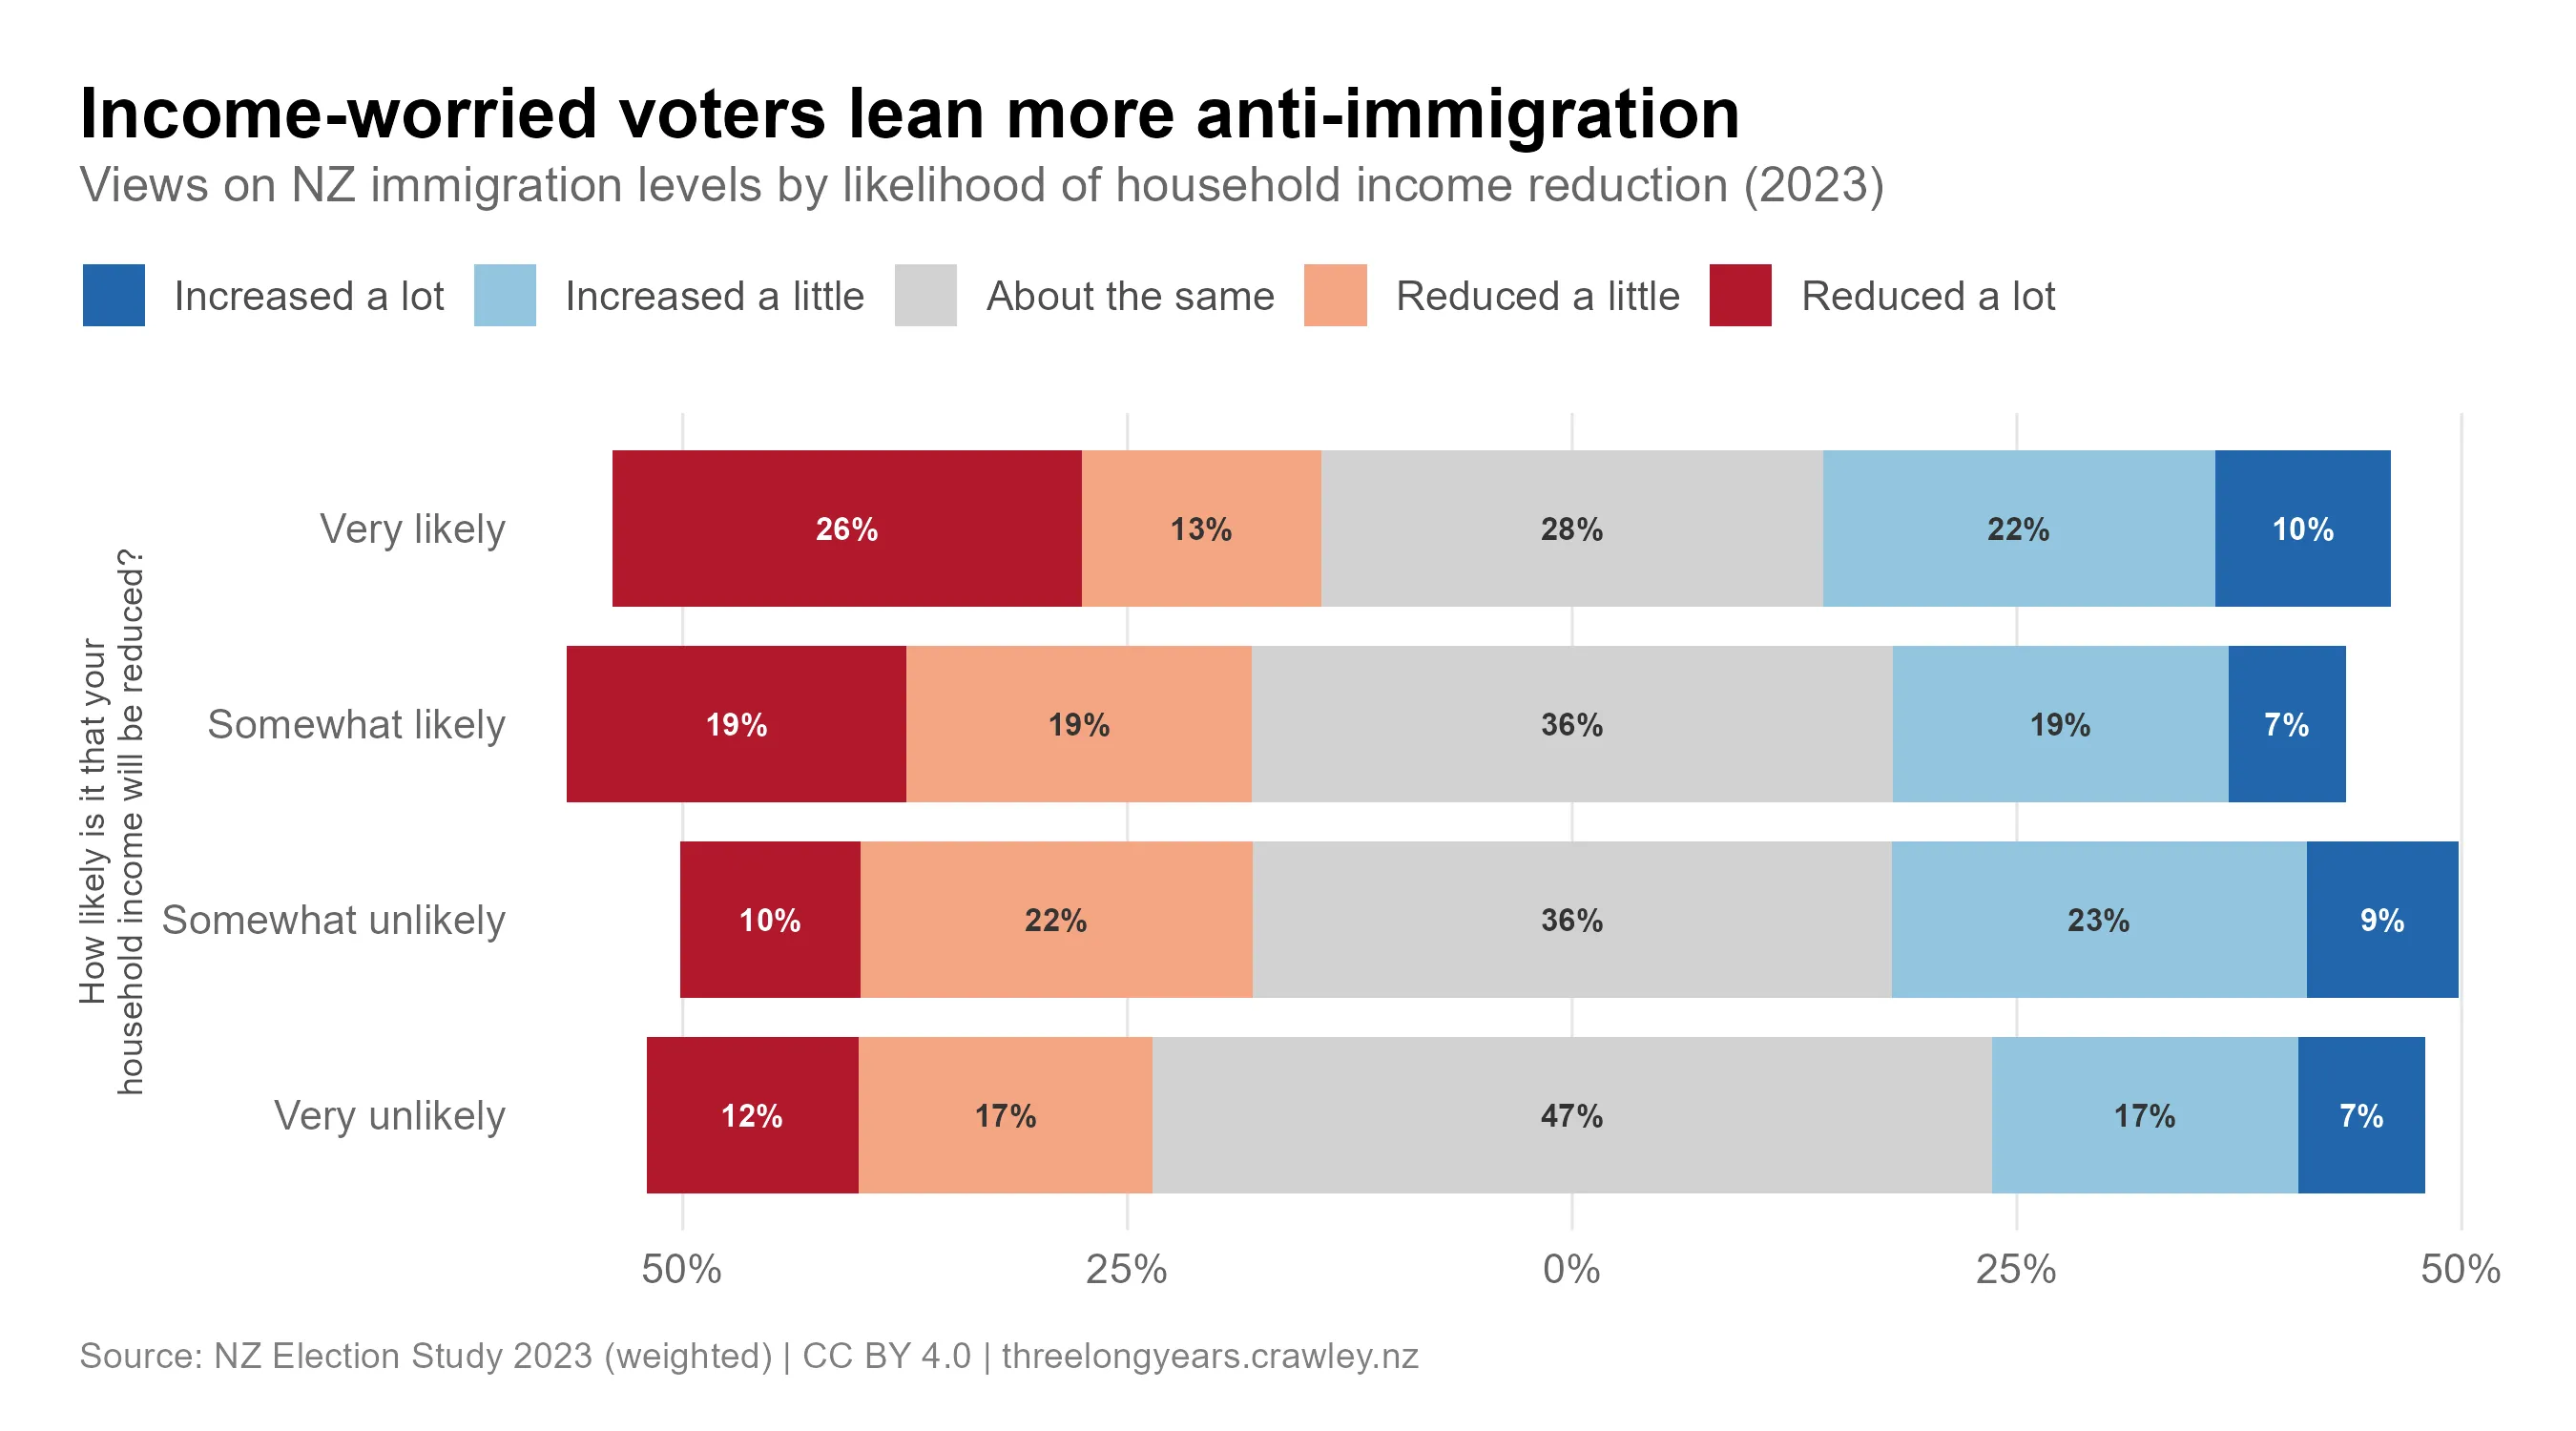
We see a similar story when viewing immigration opinions by people’s perceptions of future financial risk. People who think their household income will very likely be substantially reduced over the next 12 months are also the most likely to want immigration reductions. However, a significant proportion (32%) of people in that category want immigration increased, so economic anxiety doesn’t map cleanly onto anti-immigration views.
Overall, these results are consistent with people opposing immigration on economic grounds.
Cultural indicators
Ideally, to understand how much anti-immigration attitudes relate to culture, we would have measures of acceptance of cultural diversity. Unfortunately, there is no question like this in NZES. However, we can still get useful insights from some other relevant questions.
NZES asks people what traits they consider important for being a “true” New Zealander. As the figure shows, few people think it’s necessary to have grandparents born in NZ to be a true New Zealander, and only a minority (although a substantial one) view being born here as key to NZ identity. The vast majority (76%) think speaking English is very or fairly important.
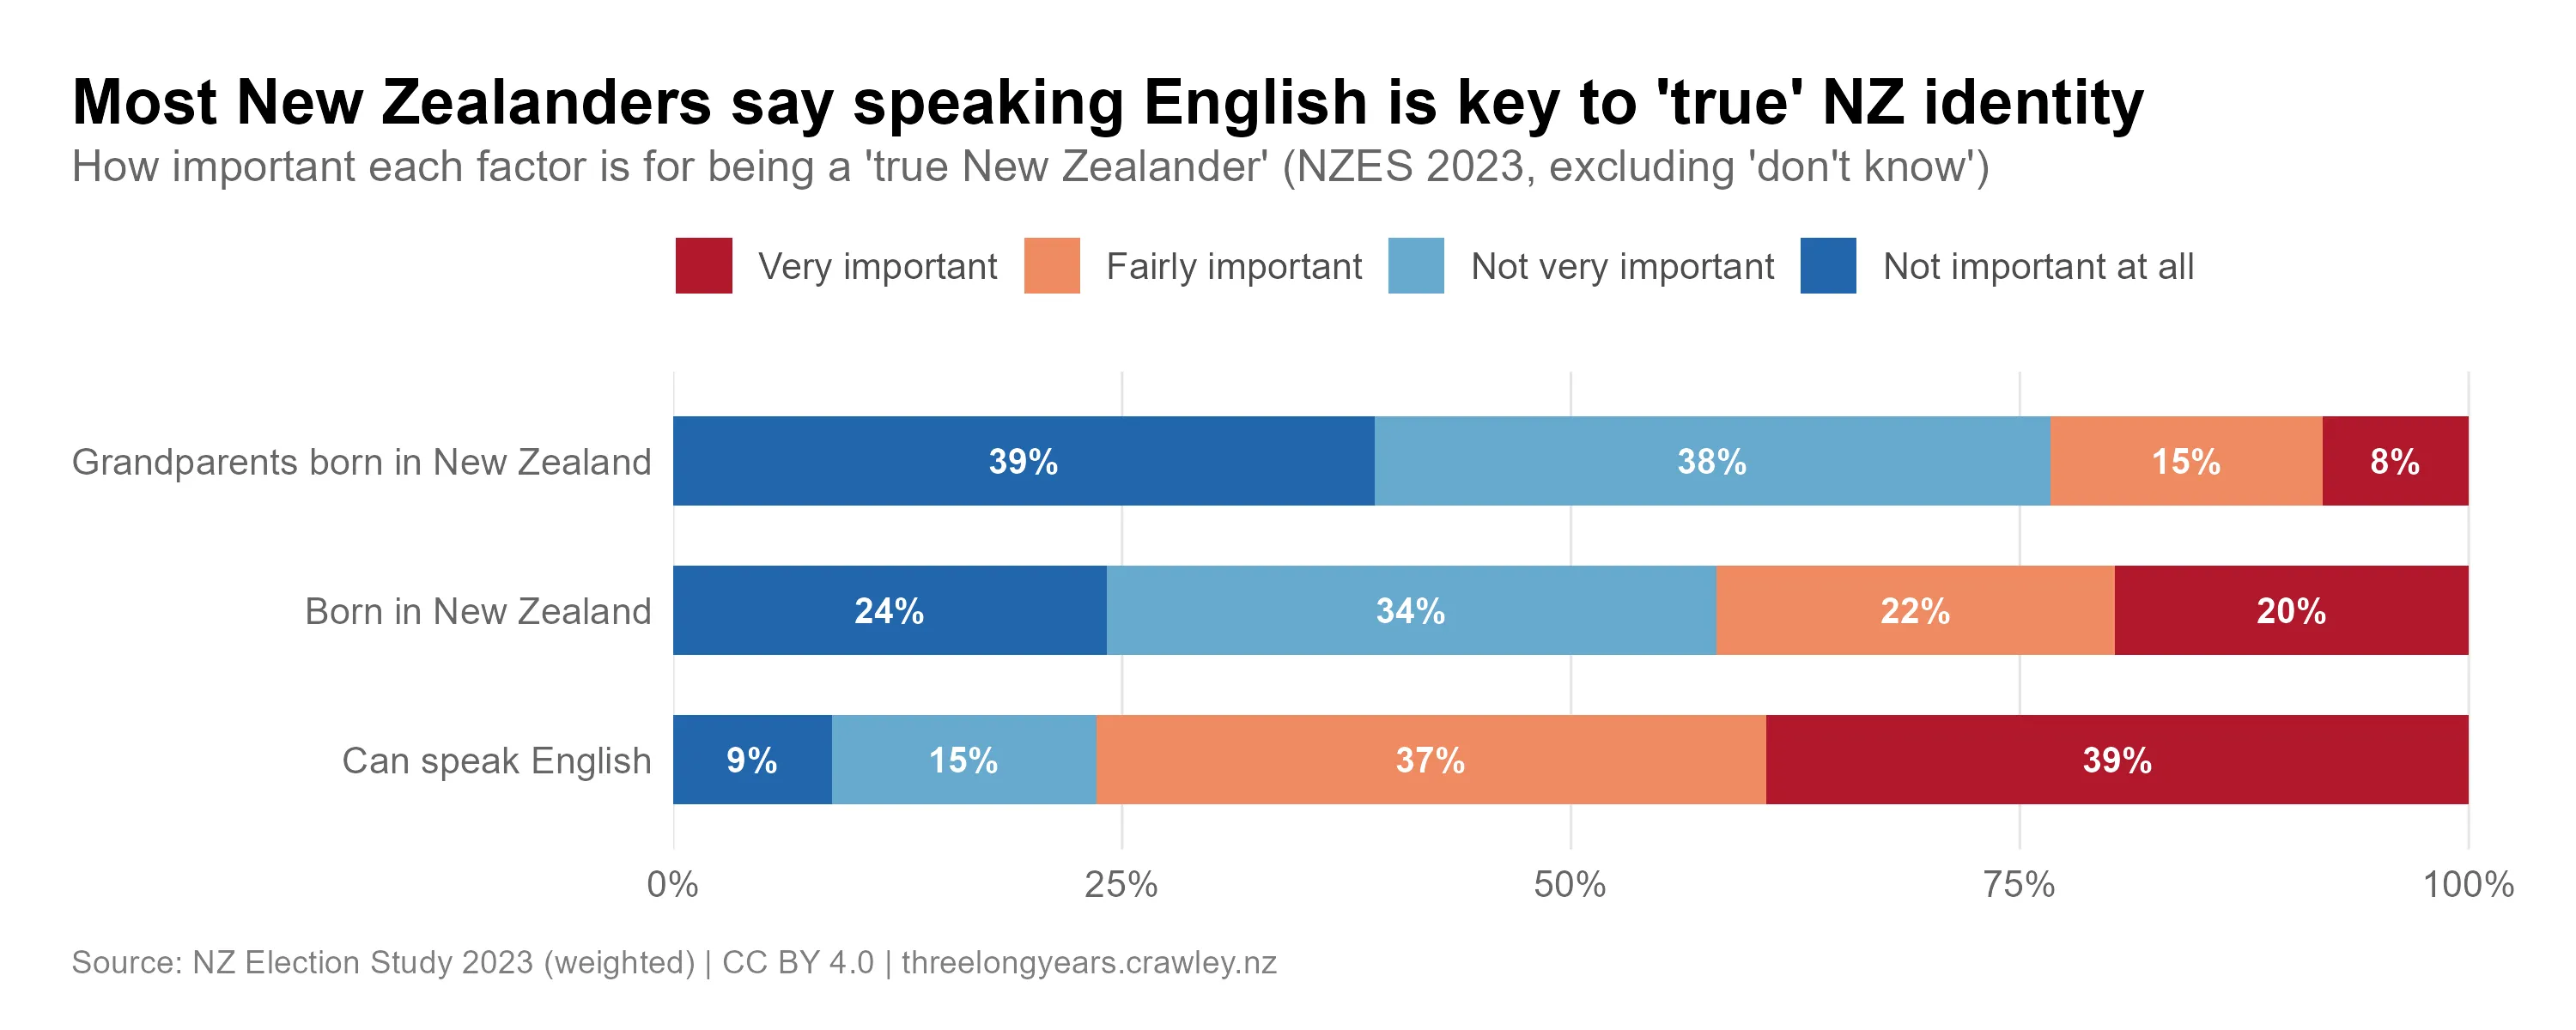
The answers to these questions suggest there are substantial levels of “nativism” among the NZ public, given that 42% of people think being born in NZ is important to be considered a “true” New Zealander. This aligns with the results of a recent Helen Clark Foundation survey on social cohesion, which found 25% of Kiwis held a very or somewhat negative view of immigrants from India, and 23% from China — compared to just 5% from Australia and 6% from the UK. In other words, some anti-immigration sentiment in NZ is clearly cultural.2
Views on immigration levels by parents' country of birth
Comparing Aotearoa to the world
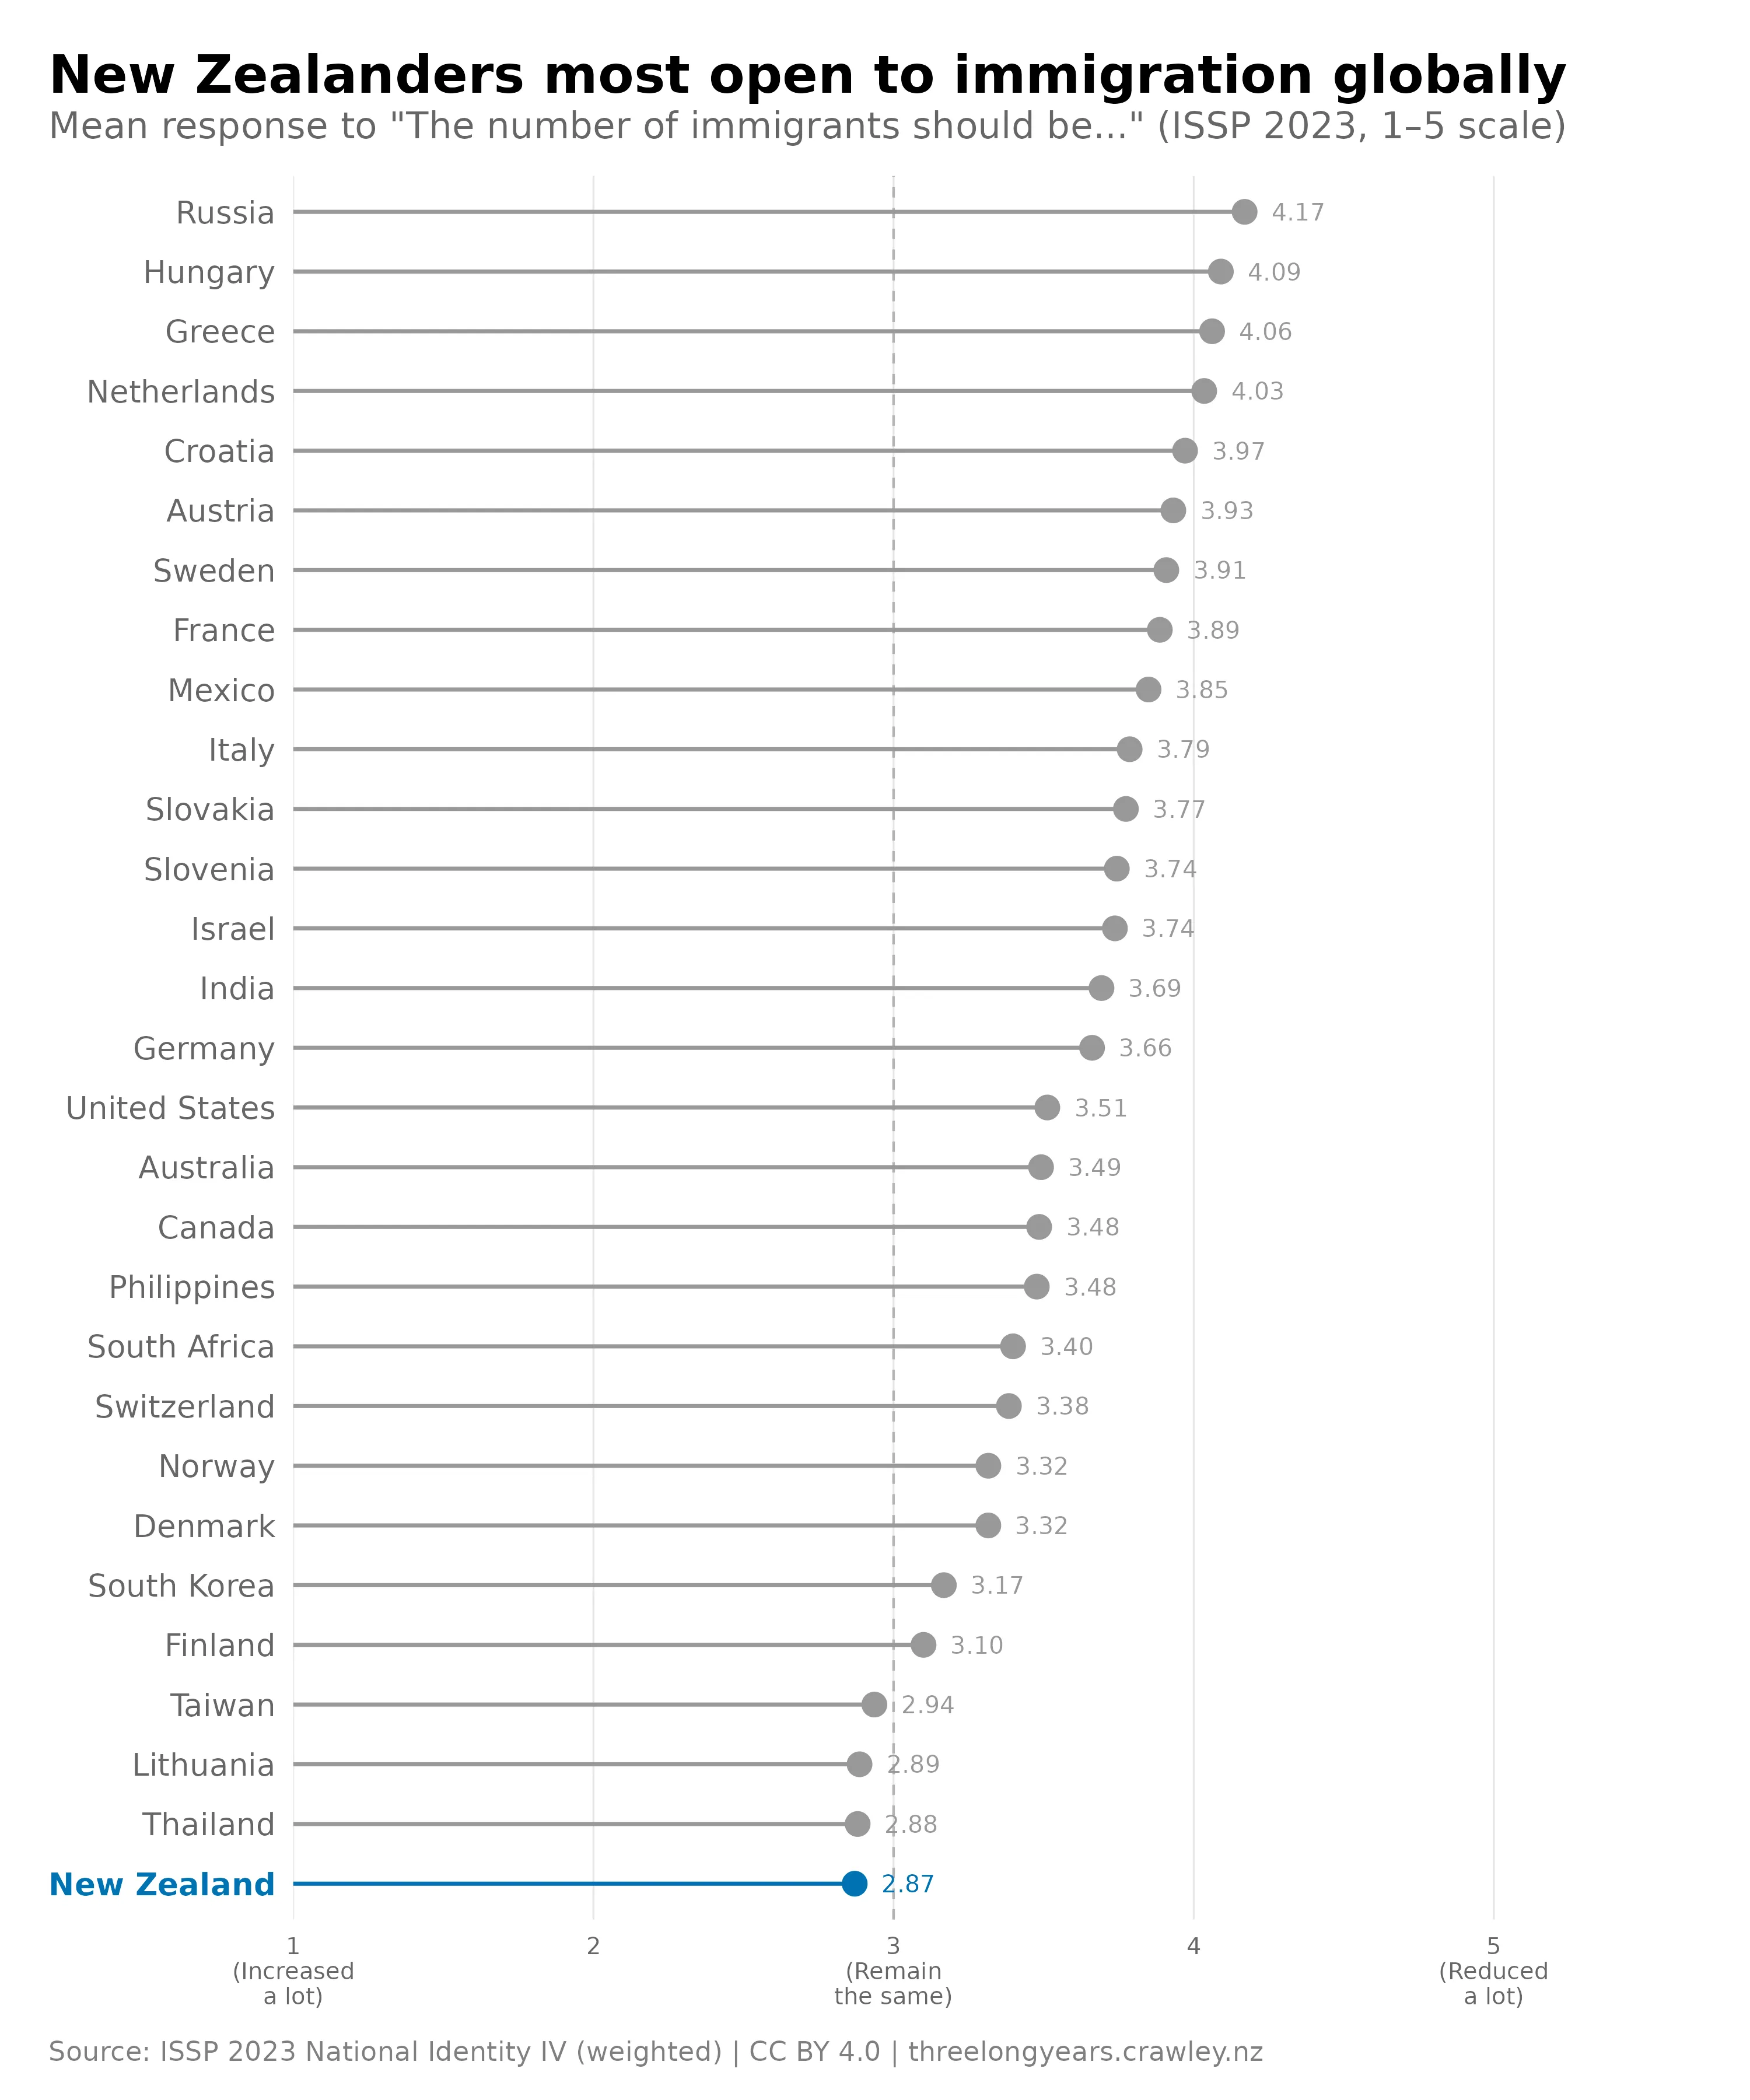
How do Kiwis’ immigration attitudes compare to the rest of the world? I analysed ISSP data and found that New Zealand has the lowest anti-immigrant sentiment of all the countries included in the study. Countries where the radical right has been strong — such as Hungary, the Netherlands and Austria — have among the highest.
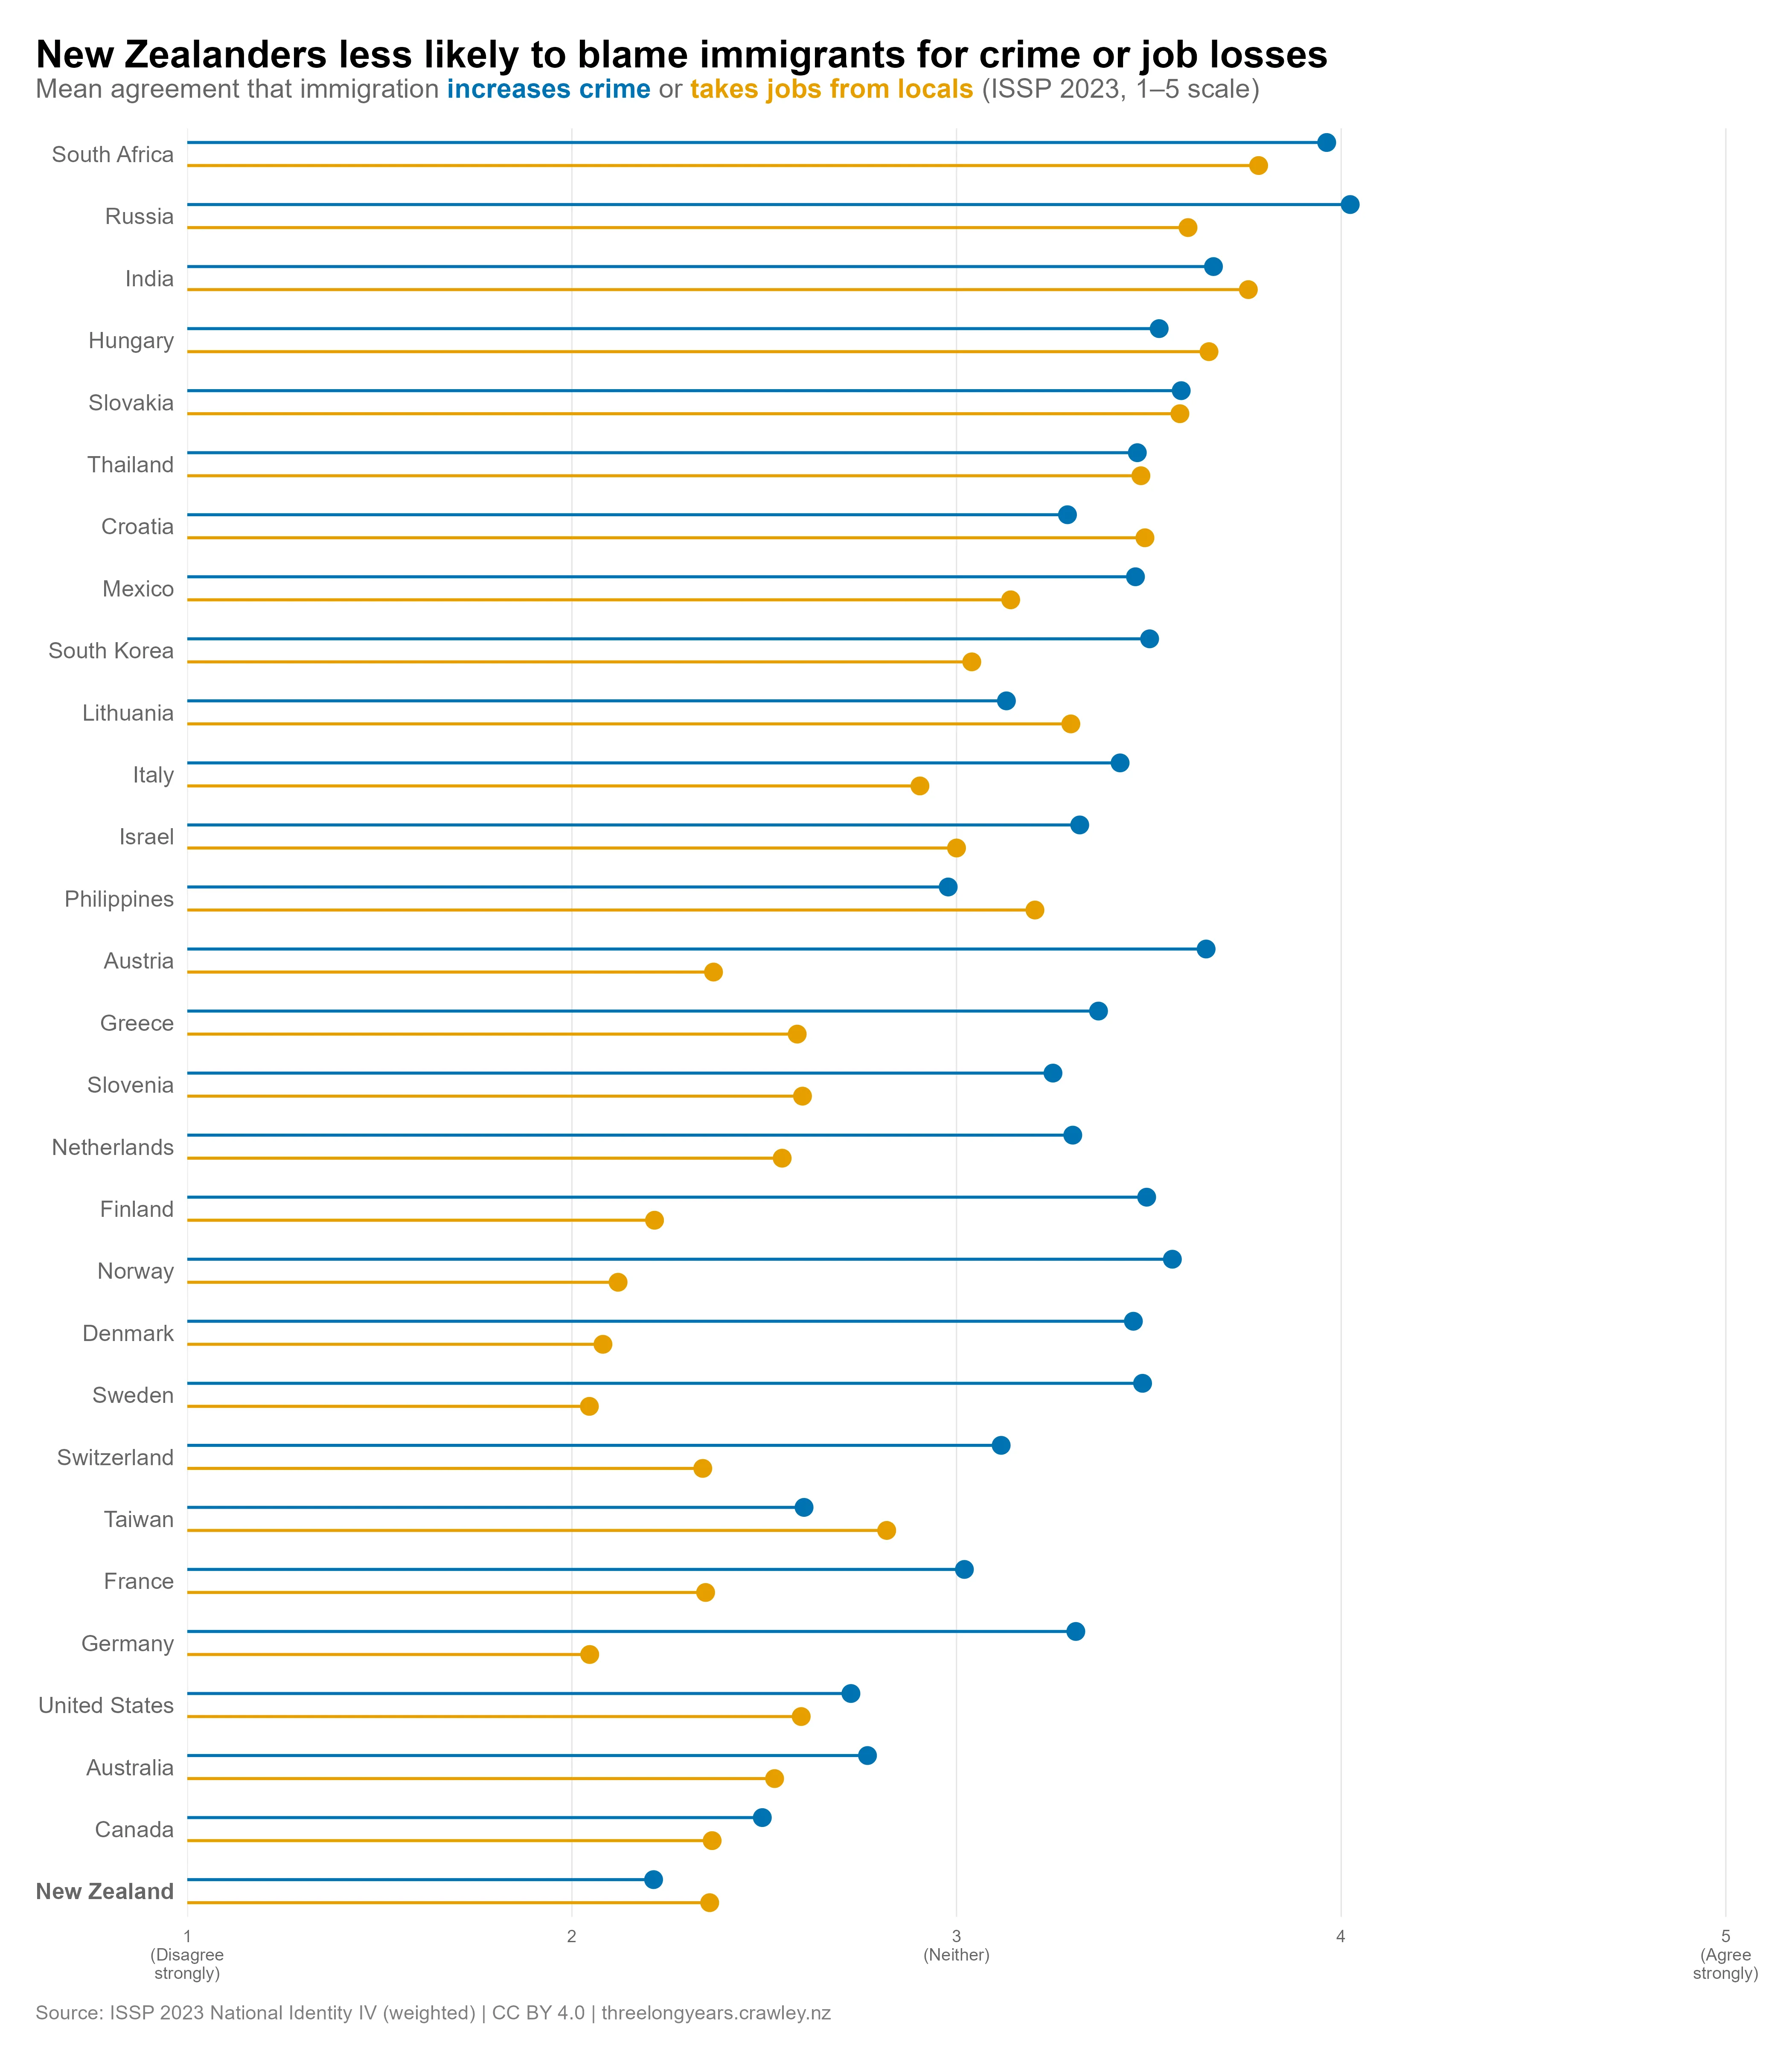
When asked about whether immigration is likely to increase crime, NZ again scores lowest. Kiwis were also among the least likely to think that immigration would lead to fewer jobs for locals.3
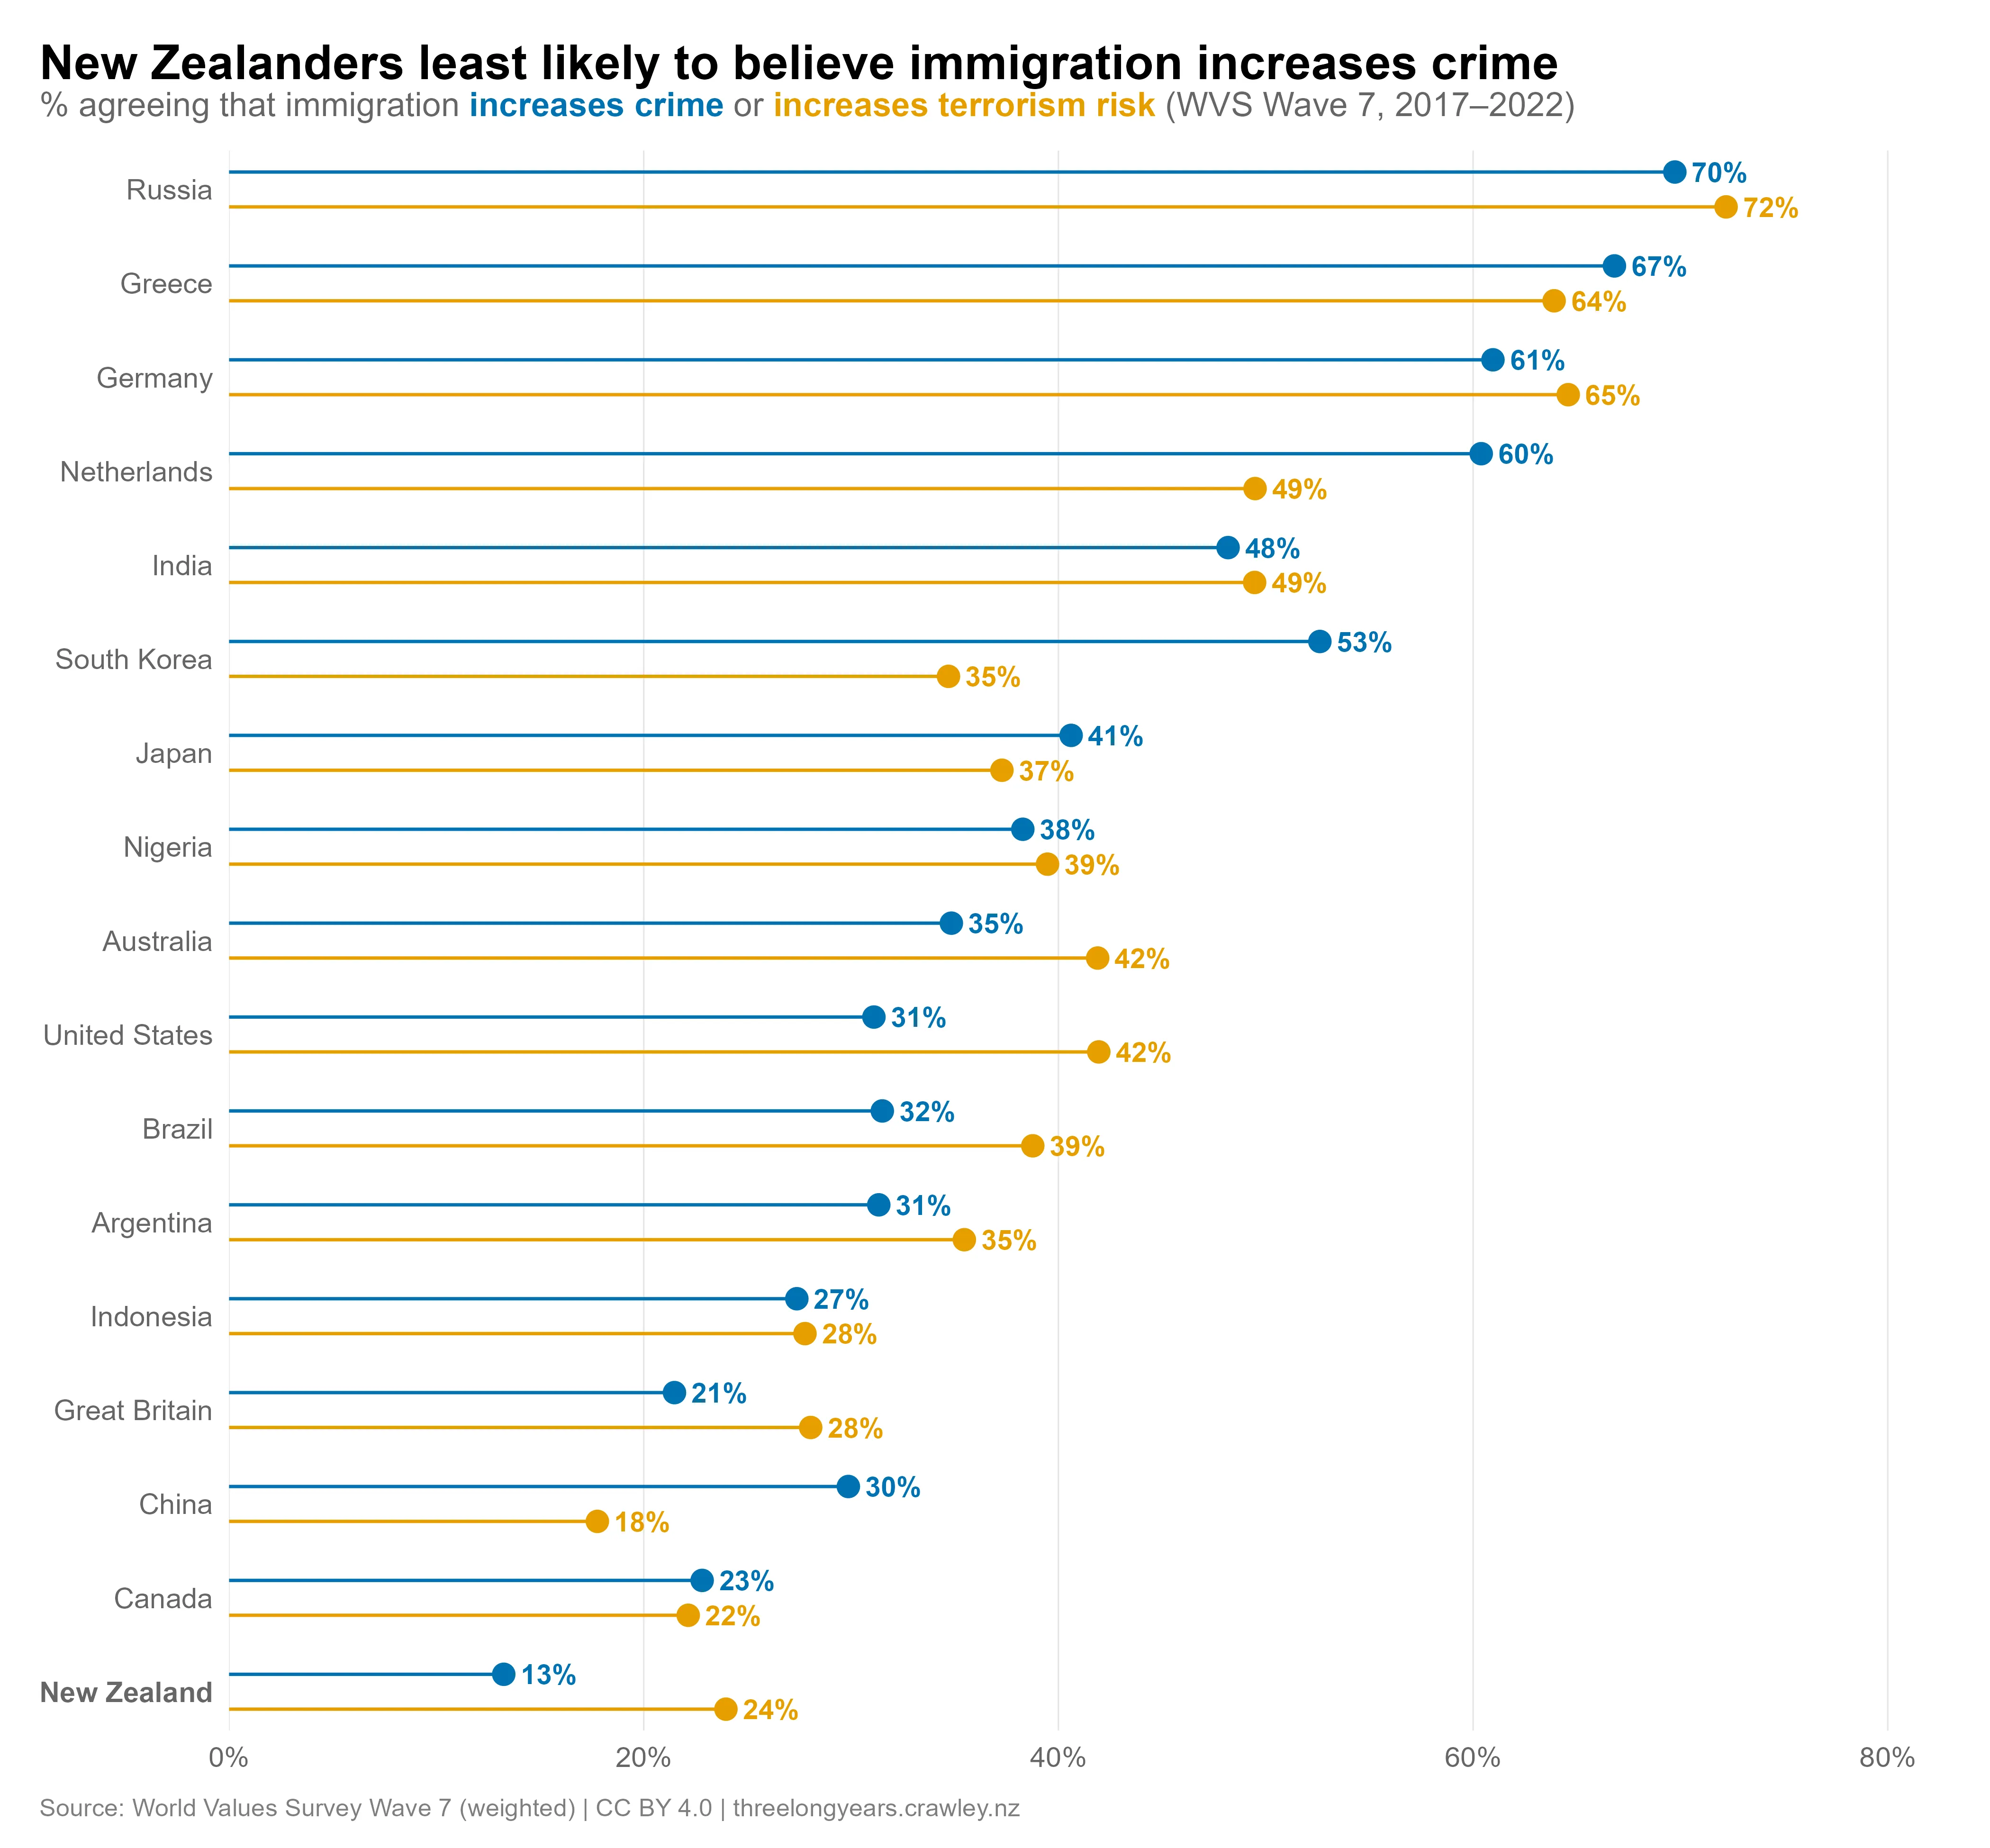
Immigration, crime and terrorism risk: World Values Survey
Why is New Zealand different?
New Zealand stands out from comparable countries when it comes to immigration attitudes. We have lower levels of opposition to immigration than almost any country in the world.
A lot of the opposition to immigration that does exist in NZ is based on economic concerns. The cost of living is hitting many Kiwis hard, and people may feel that it will only get harder if there are more immigrants arriving (which may or may not be true). That said, it’s clear that there is cultural opposition to immigration too.
The New Zealand public’s attitudes towards immigration probably differ from other countries — in part — due to our geographic isolation (meaning irregular immigration is very rare), our long history of immigration, and biculturalism. Moreover, a high proportion of immigrants to NZ are from countries such as the UK, Australia and South Africa — countries with very similar cultures, meaning the scope for cultural opposition to immigration is reduced.
A couple of things complicate this picture. As I noted last time, opposition to immigration in NZ was very low in 2023 compared with previous years. This is probably related to the pandemic, which may have affected other countries differently. The period immediately following the pandemic could therefore be unusual for NZ in terms of anti-immigration sentiment.
Moreover, there is clear evidence that some opposition to immigration here is about culture and — as the Helen Clark Foundation findings suggest — race. We’ve seen anti-immigration sentiment spike up sharply in other countries, and as lead researcher on the Helen Clark Foundation report, Shamubeel Eaqub, put it, “our views on immigration are hardening very fast”. Immigration may rarely have been a major election issue in NZ, but if attitudes are hardening as fast as Eaqub suggests, 2026 could be different.
Footnotes
-
The “No income” category typically includes a range of people, including wealthier people who are not working. ↩
-
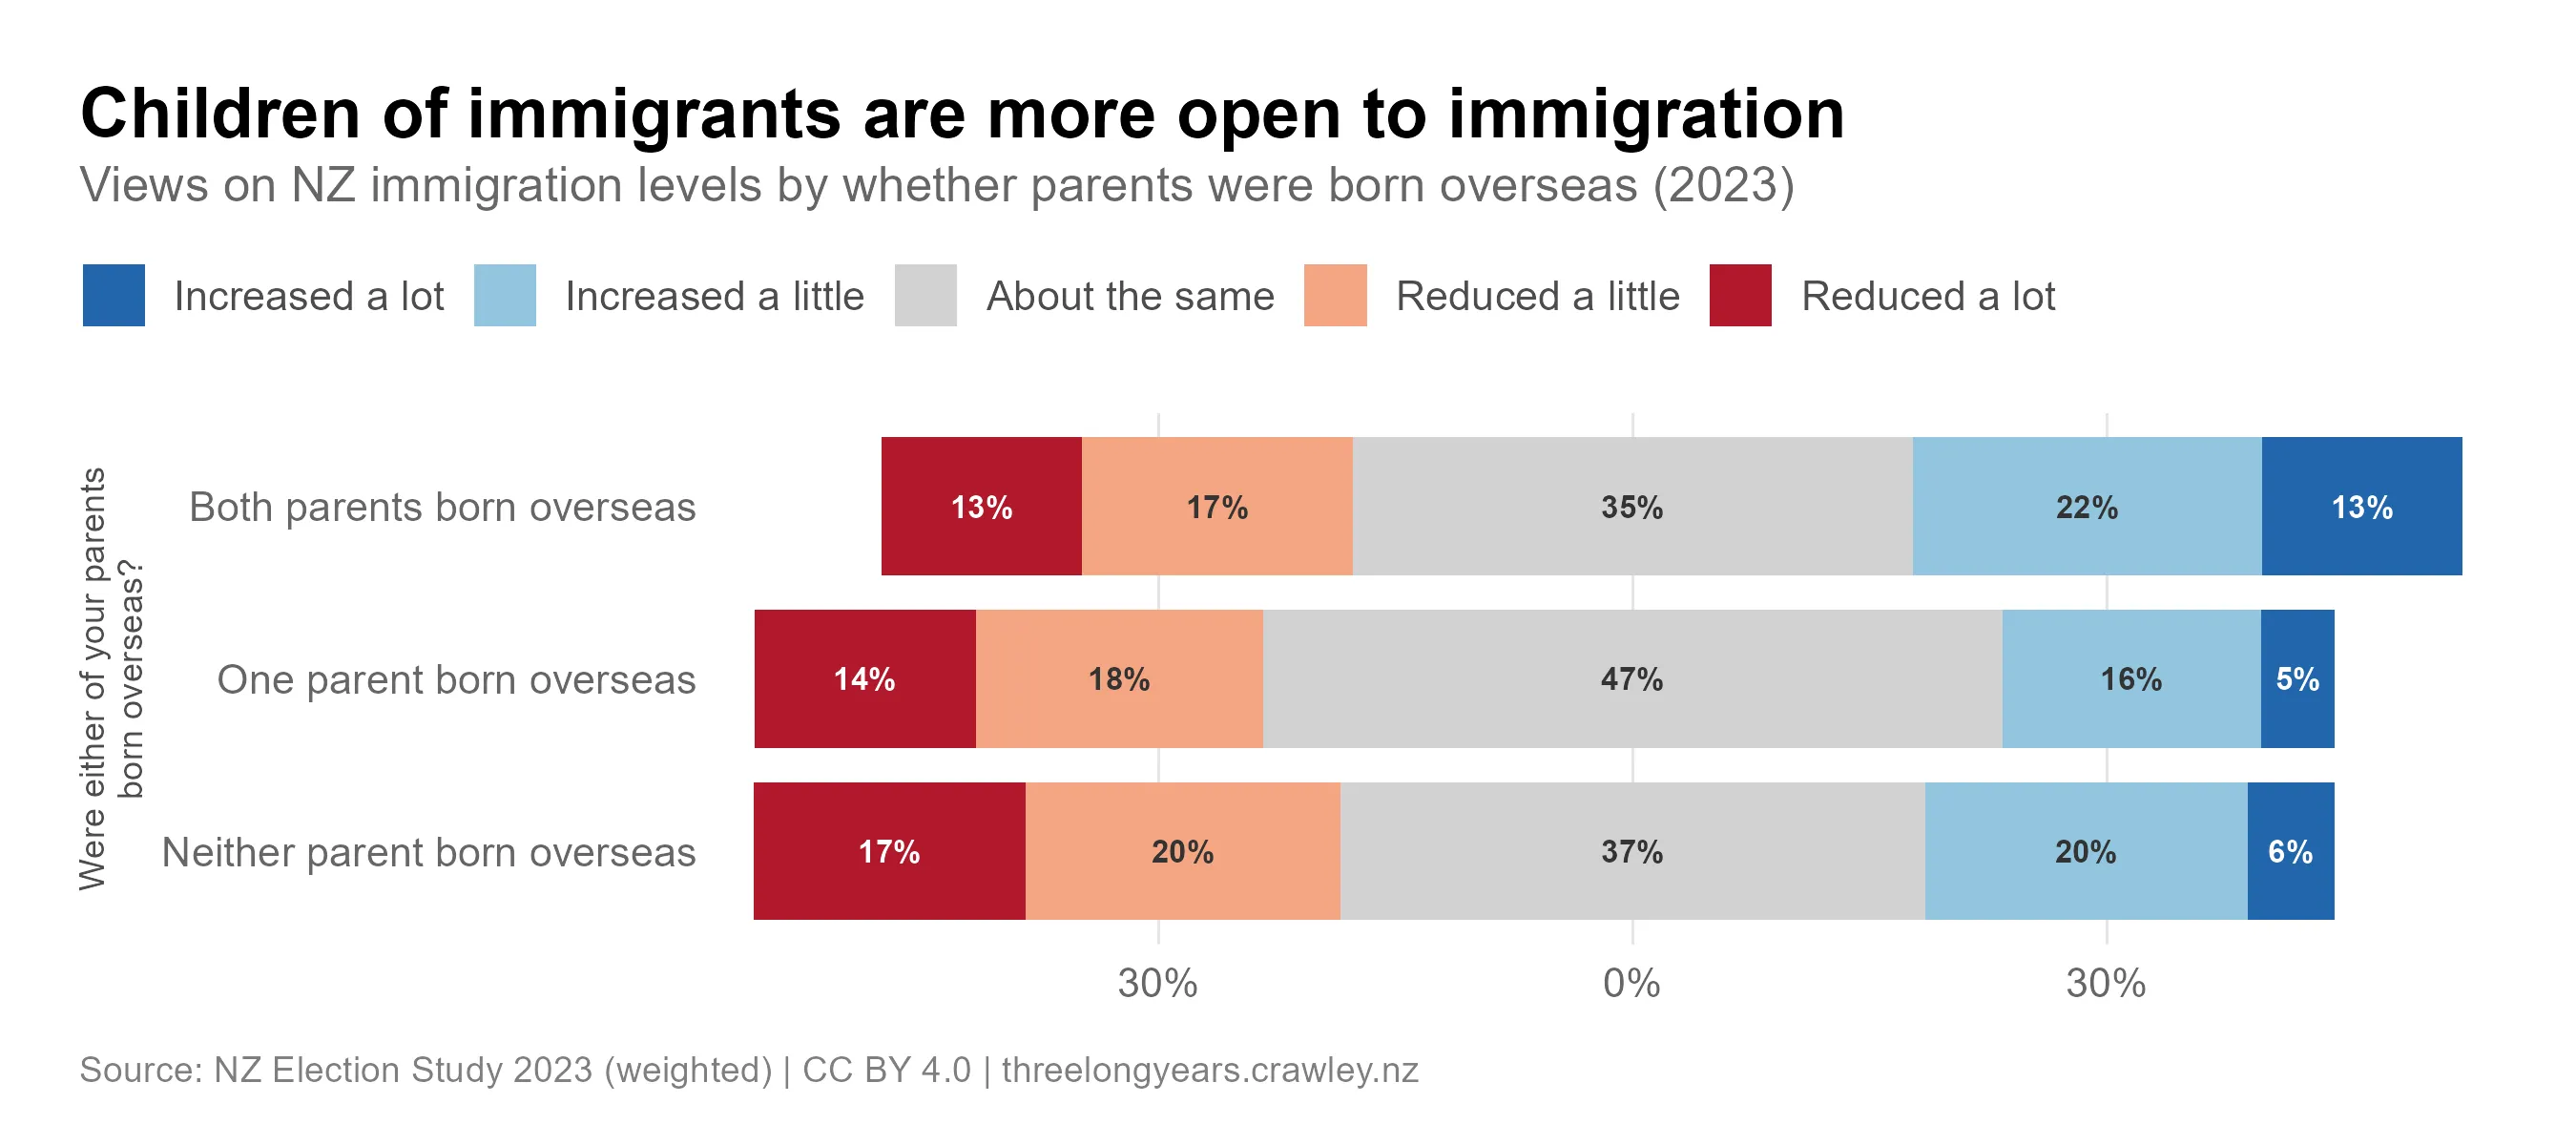
I also investigated how anti-immigration sentiment differs depending on a person’s immigration background (see supplemental figure). Those with both parents born overseas were clearly the most open to immigration. Those with one or neither parent born overseas both leaned mildly anti-immigration to a similar degree, though the neither-parent group was slightly more opposed. ↩
-
I have included a supplemental figure with some similar questions from World Values Survey. These also show NZ has among the least anti-immigration. This survey was conducted between mid-2019 and early 2020 in NZ, and so somewhat reduces concerns that the NZES/ISSP surveys were done at an unusual time for immigration attitudes in NZ (i.e. after the pandemic). Among all 66 countries in WVS7, NZ scores lowest on linking crime to immigration, and 10th lowest on terrorism and immigration. ↩
The analysis code for this post is available on Codeberg.
View code on Codeberg →