How satisfied are New Zealanders with democracy?

There are genuine reasons to be worried about the health of democracy around the world at the moment. Countries that once had thriving democracies — including Hungary and El Salvador — have in recent years been reclassified as “electoral autocracies”: a hybrid of democratic and authoritarian features, where multiparty elections still happen but key freedoms are eroded. Other countries, including the US, remain democratic but are backsliding on many key measures of democracy.
Surveying these events from New Zealand, we may feel fortunate to have such a healthy — if far from perfect — democracy. Our politics does not feel as polarised as it is in many other parts of the world, politicians are not accusing each other of rigging elections, and we do not have large-scale corruption scandals or attempts to reshape democratic institutions to favour the incumbent government.1
That said, as I wrote recently, expert surveys suggest the quality of democracy in New Zealand has declined under the current National-led government. In particular, public consultation processes and respect for counter-arguments are not as good as they once were.
Given these threats, it’s important to understand what the public thinks about the state of democracy. A public that is largely positive about democracy makes backsliding less likely, since people may resist attempts to erode it. In this post, I look at data from the New Zealand Election Study (NZES) and Comparative Study of Election Surveys (CSES) to find out where the NZ public sits on democracy.
Kiwis content with NZ democracy
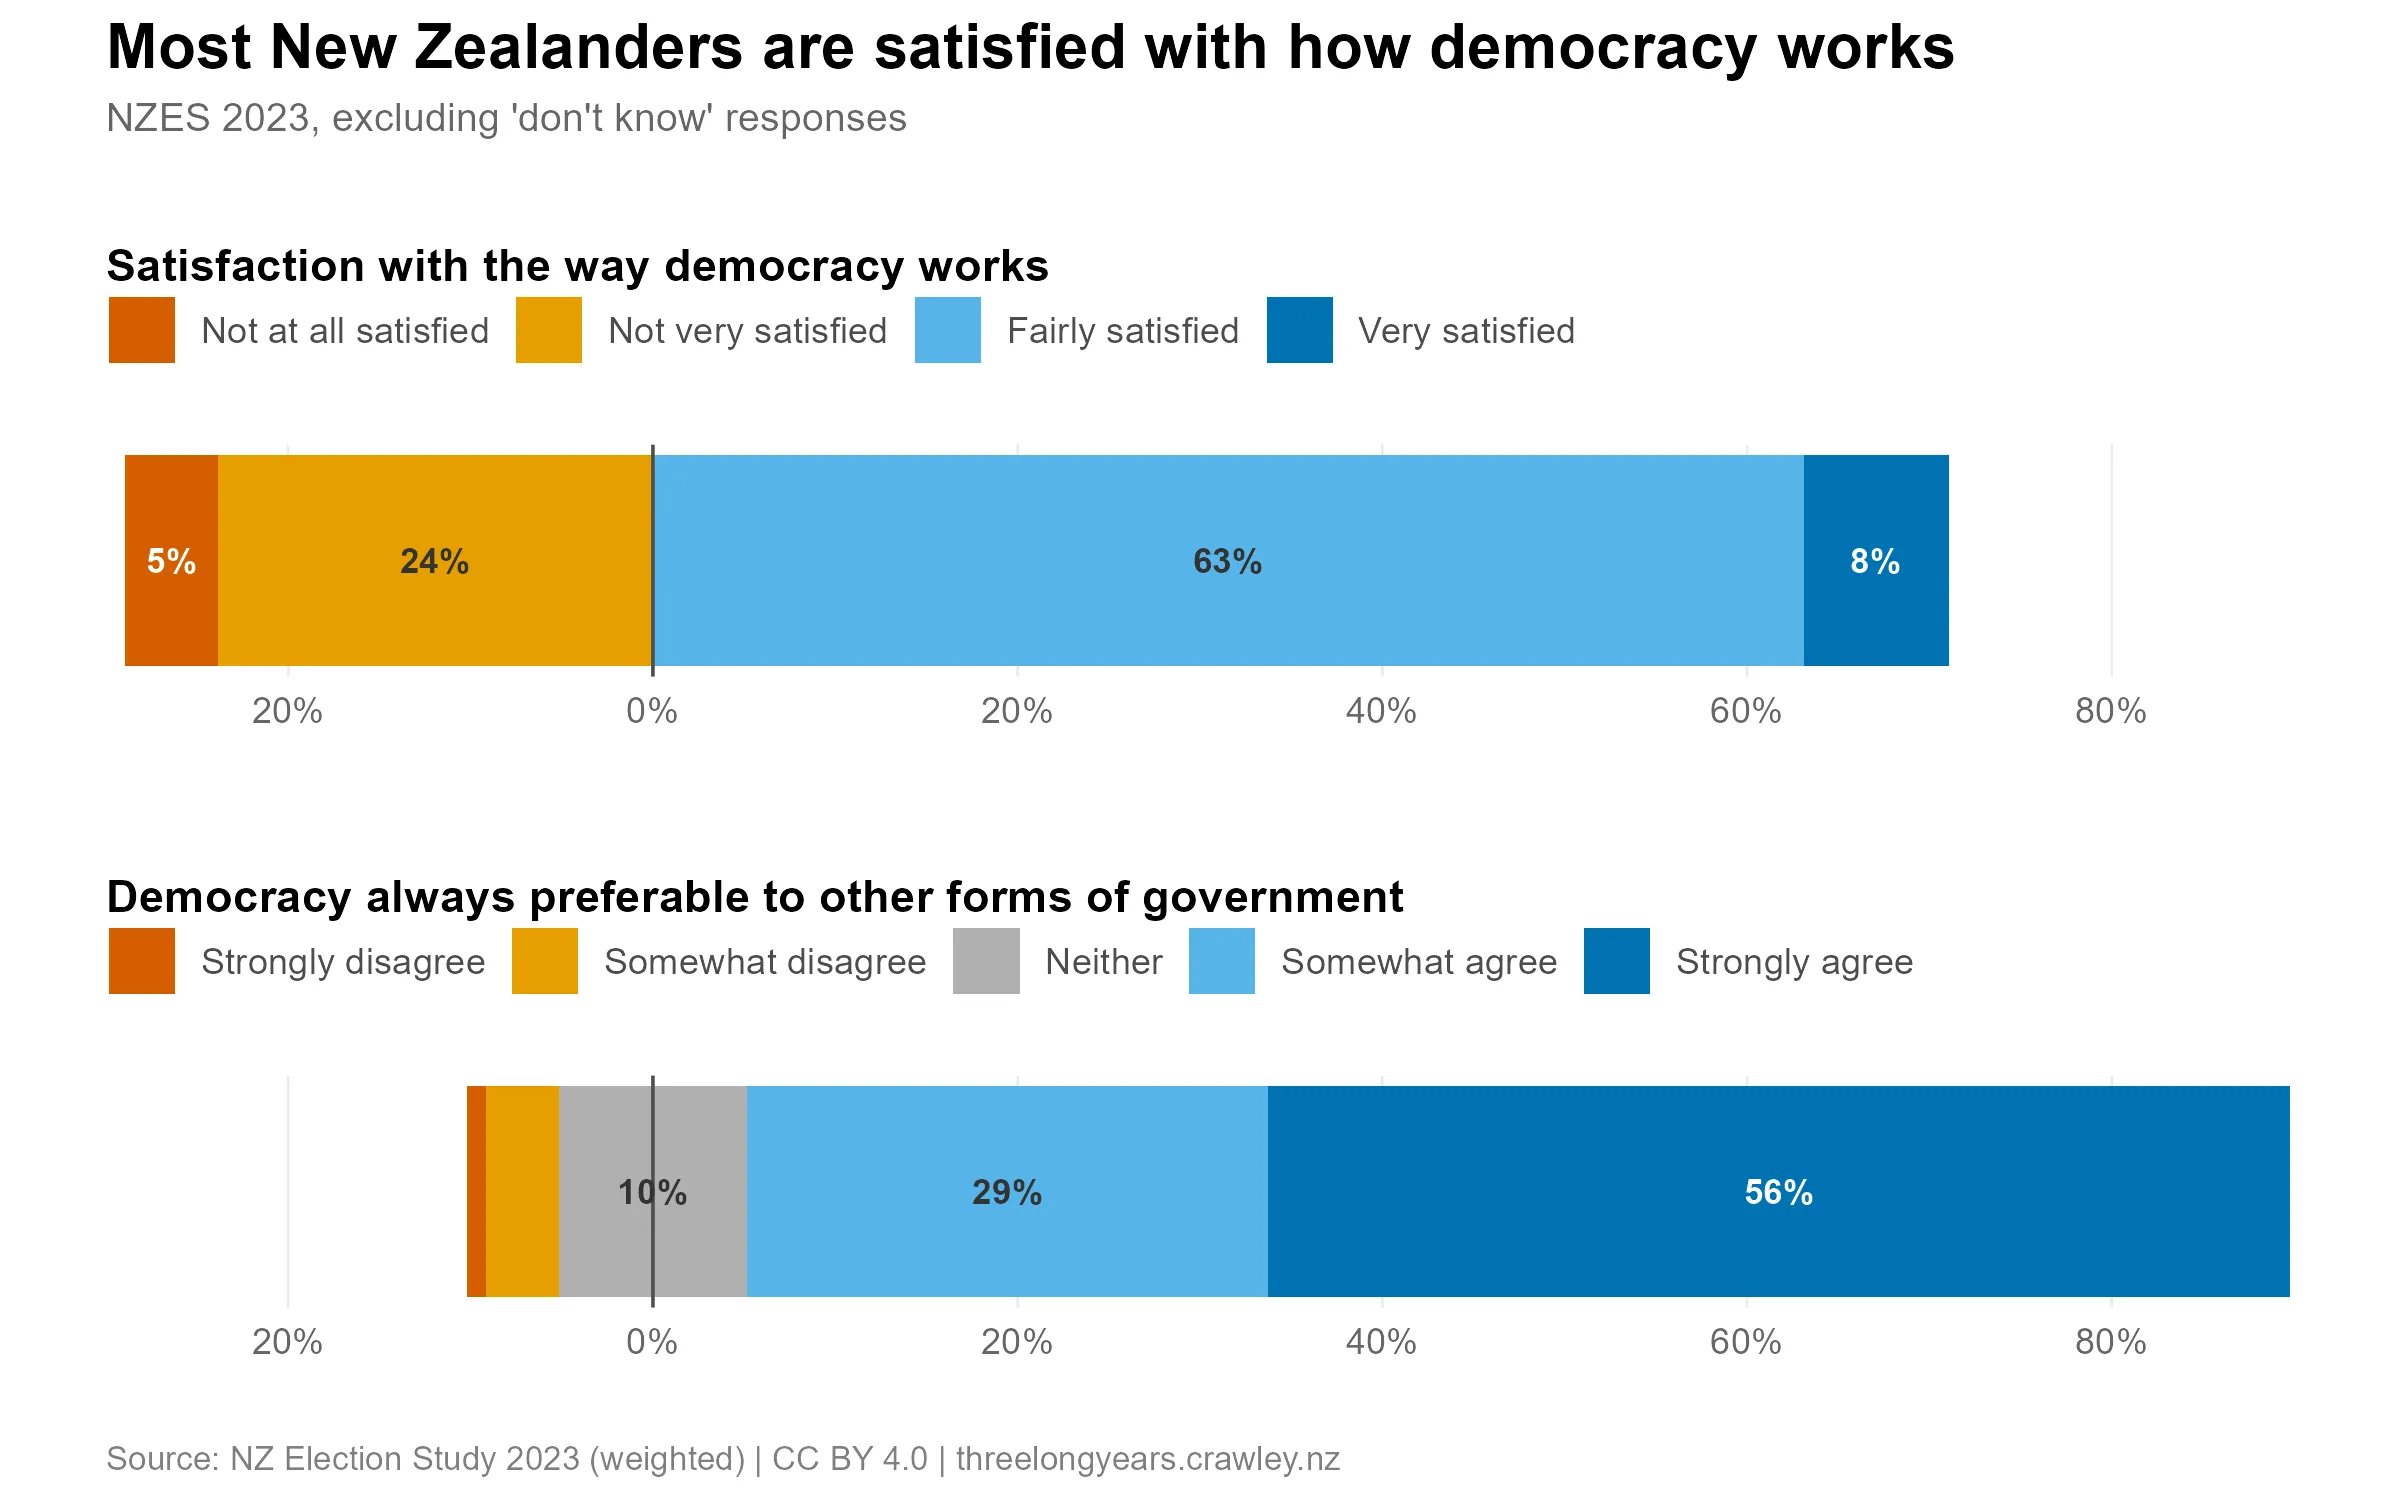
The standard survey question on public perceptions of democracy asks people how satisfied they are with democracy. The figure below shows an overwhelming majority (71%) of Kiwis were satisfied after the 2023 election. An even larger share (85%) prefer democracy to other forms of government.
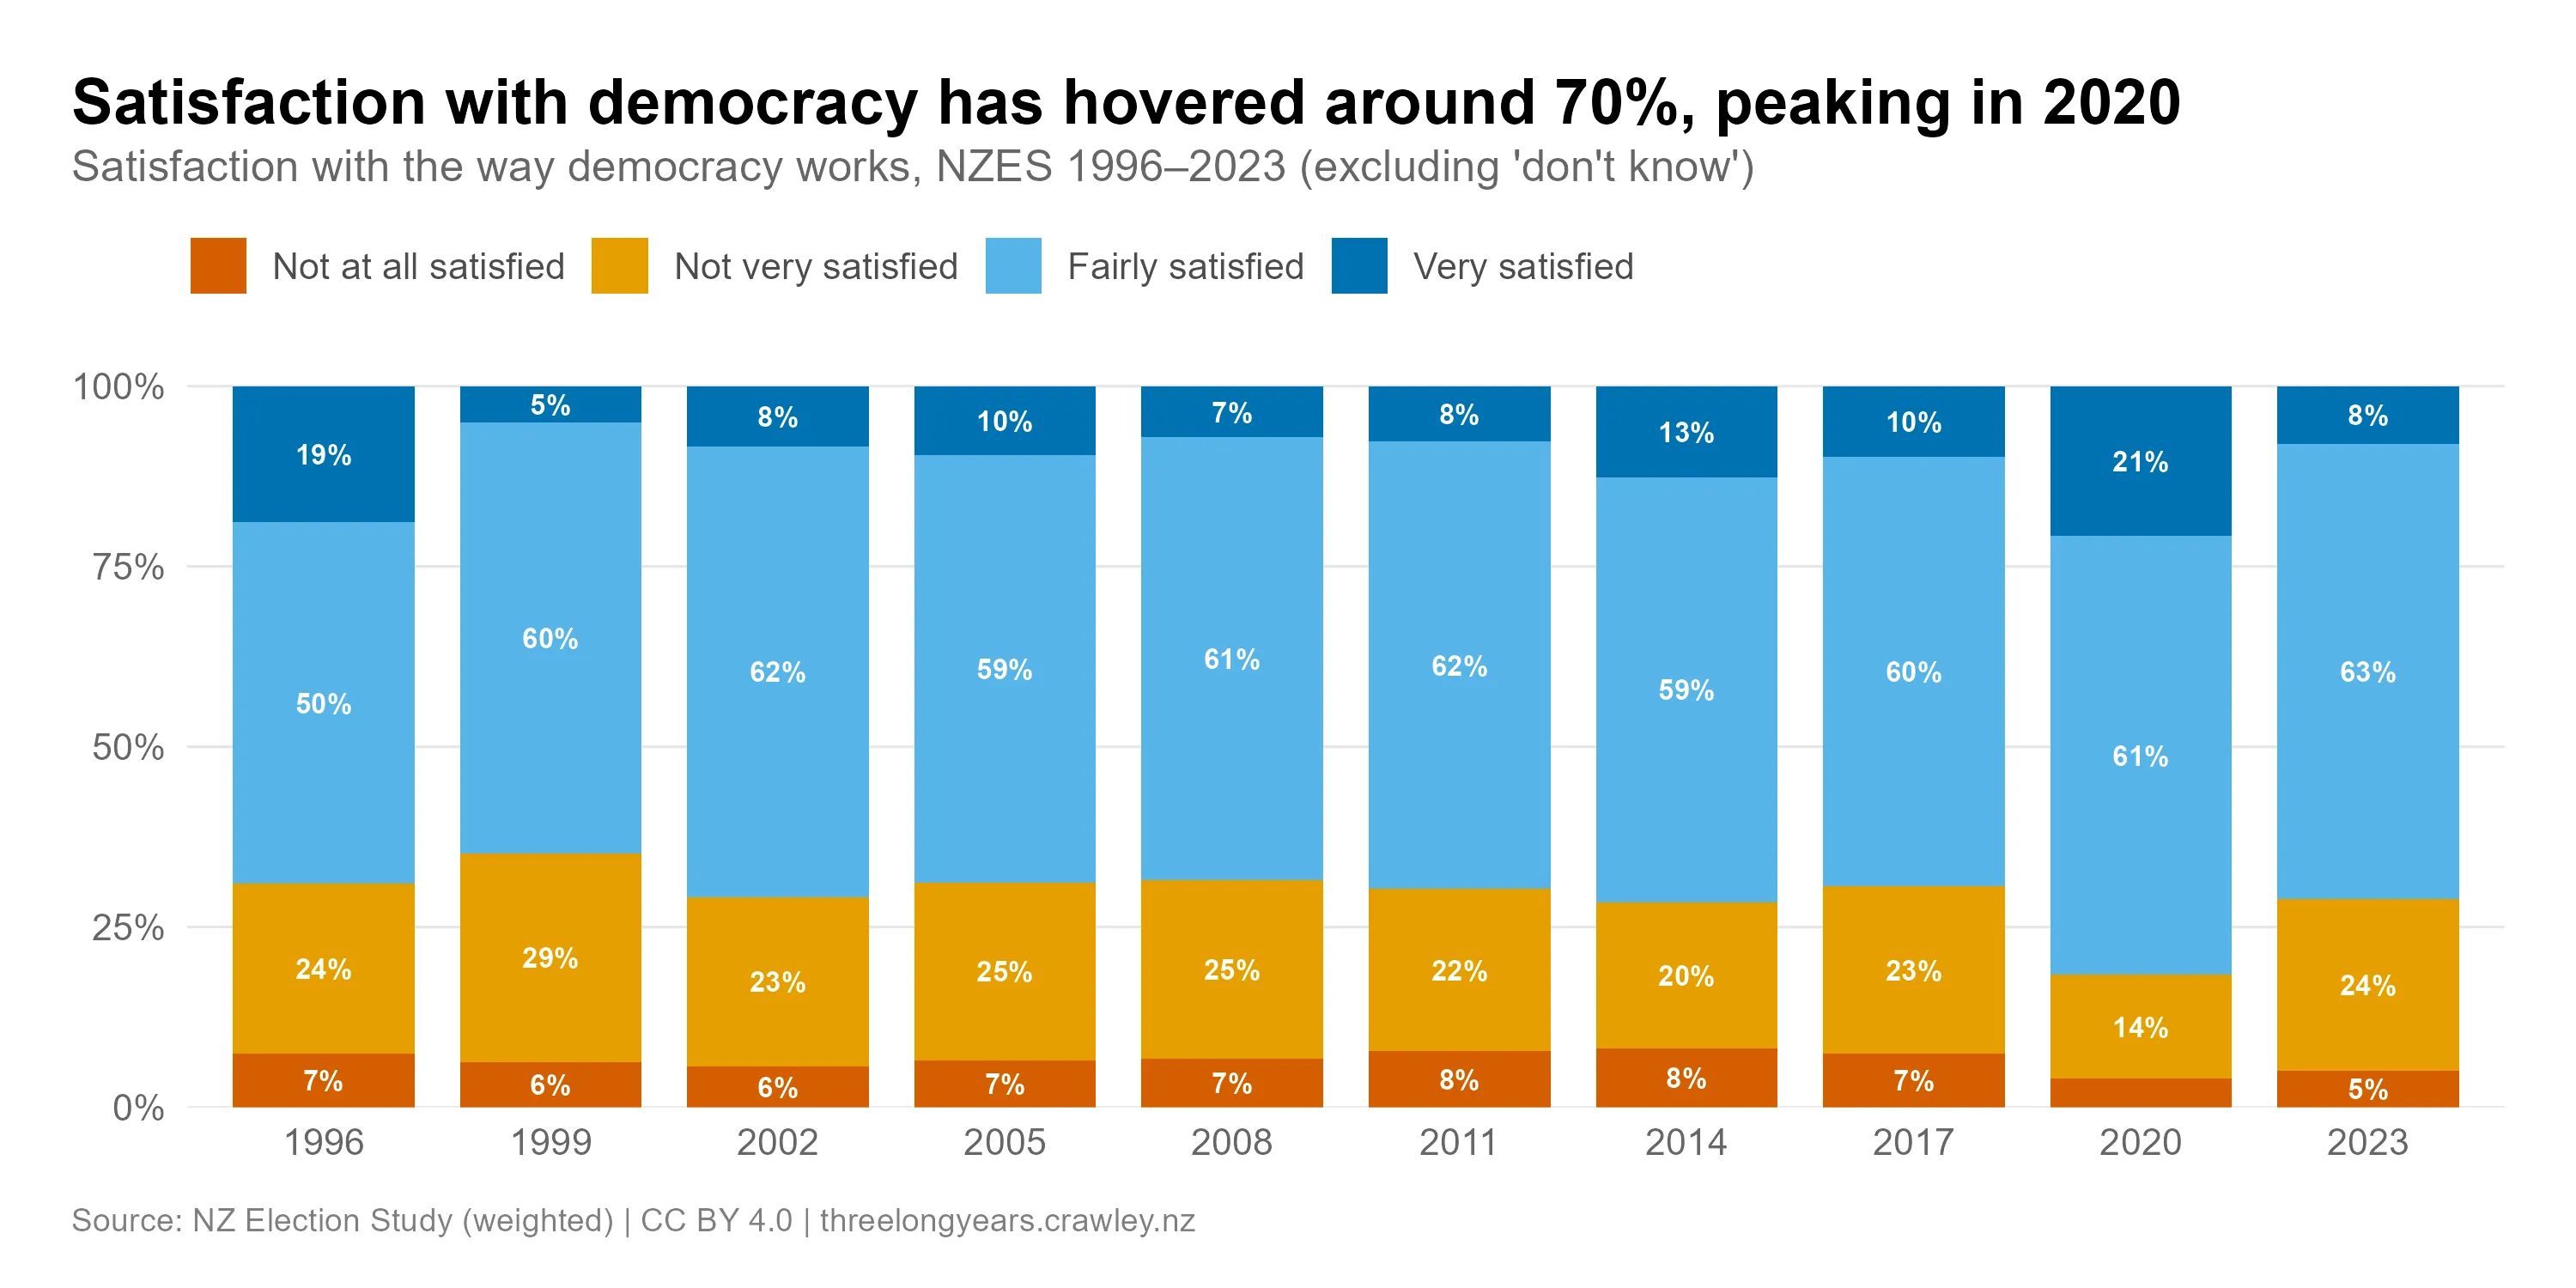
Responses to the satisfaction question have been very consistent over time, and 2023 was typical. People were particularly satisfied with democracy in 2020 — perhaps linked to the COVID response and the referendums that year.
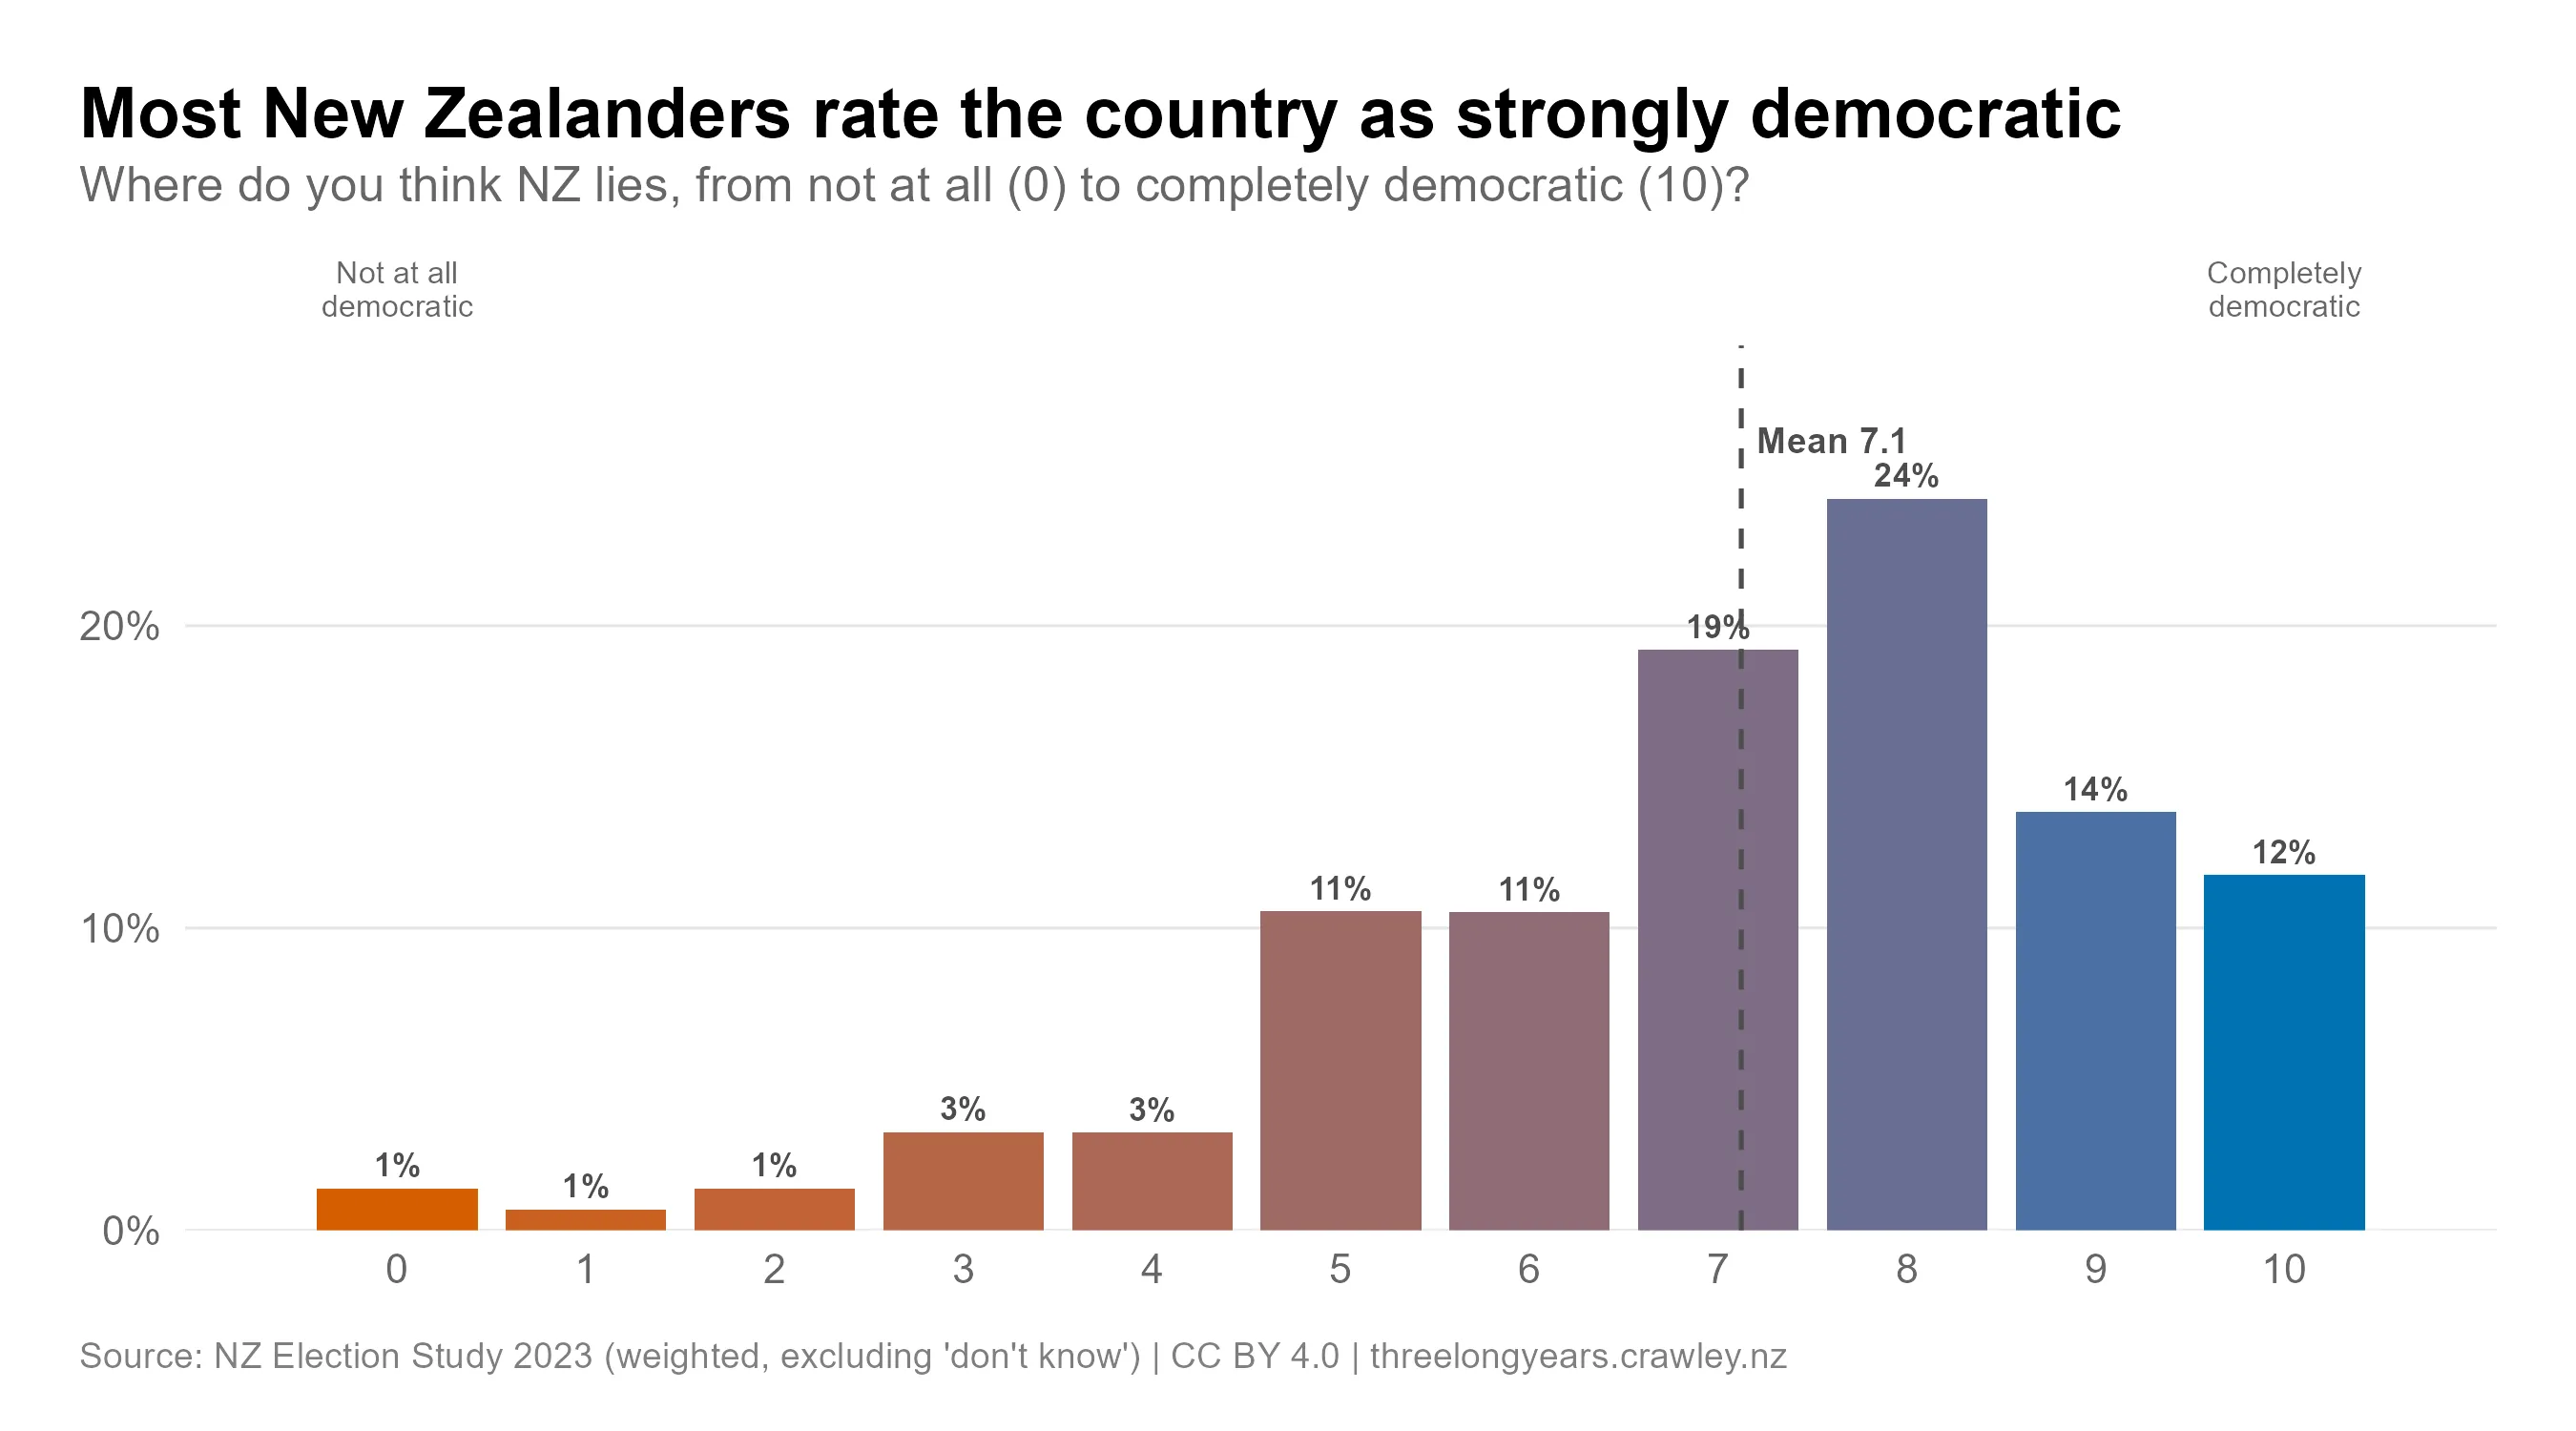
Another question asked in 2023 was how democratic people think NZ is — ranging from not at all (0) to completely (10). Again, people are very positive overall, with 50% placing NZ at an 8 out of 10 or higher. Most other responses sit between 5 and 7; only around 10% place NZ below the midpoint — few see the country as undemocratic.
Overall, the NZ public sees democracy favourably. But how does that compare to the rest of the world?
How the NZ public’s perceptions of democracy compare
The “satisfaction with democracy” question is part of CSES, which combines the results of election studies from around the world. New Zealanders’ satisfaction with democracy compares quite favourably with a range of other countries, substantially higher than France, Poland and Portugal.2
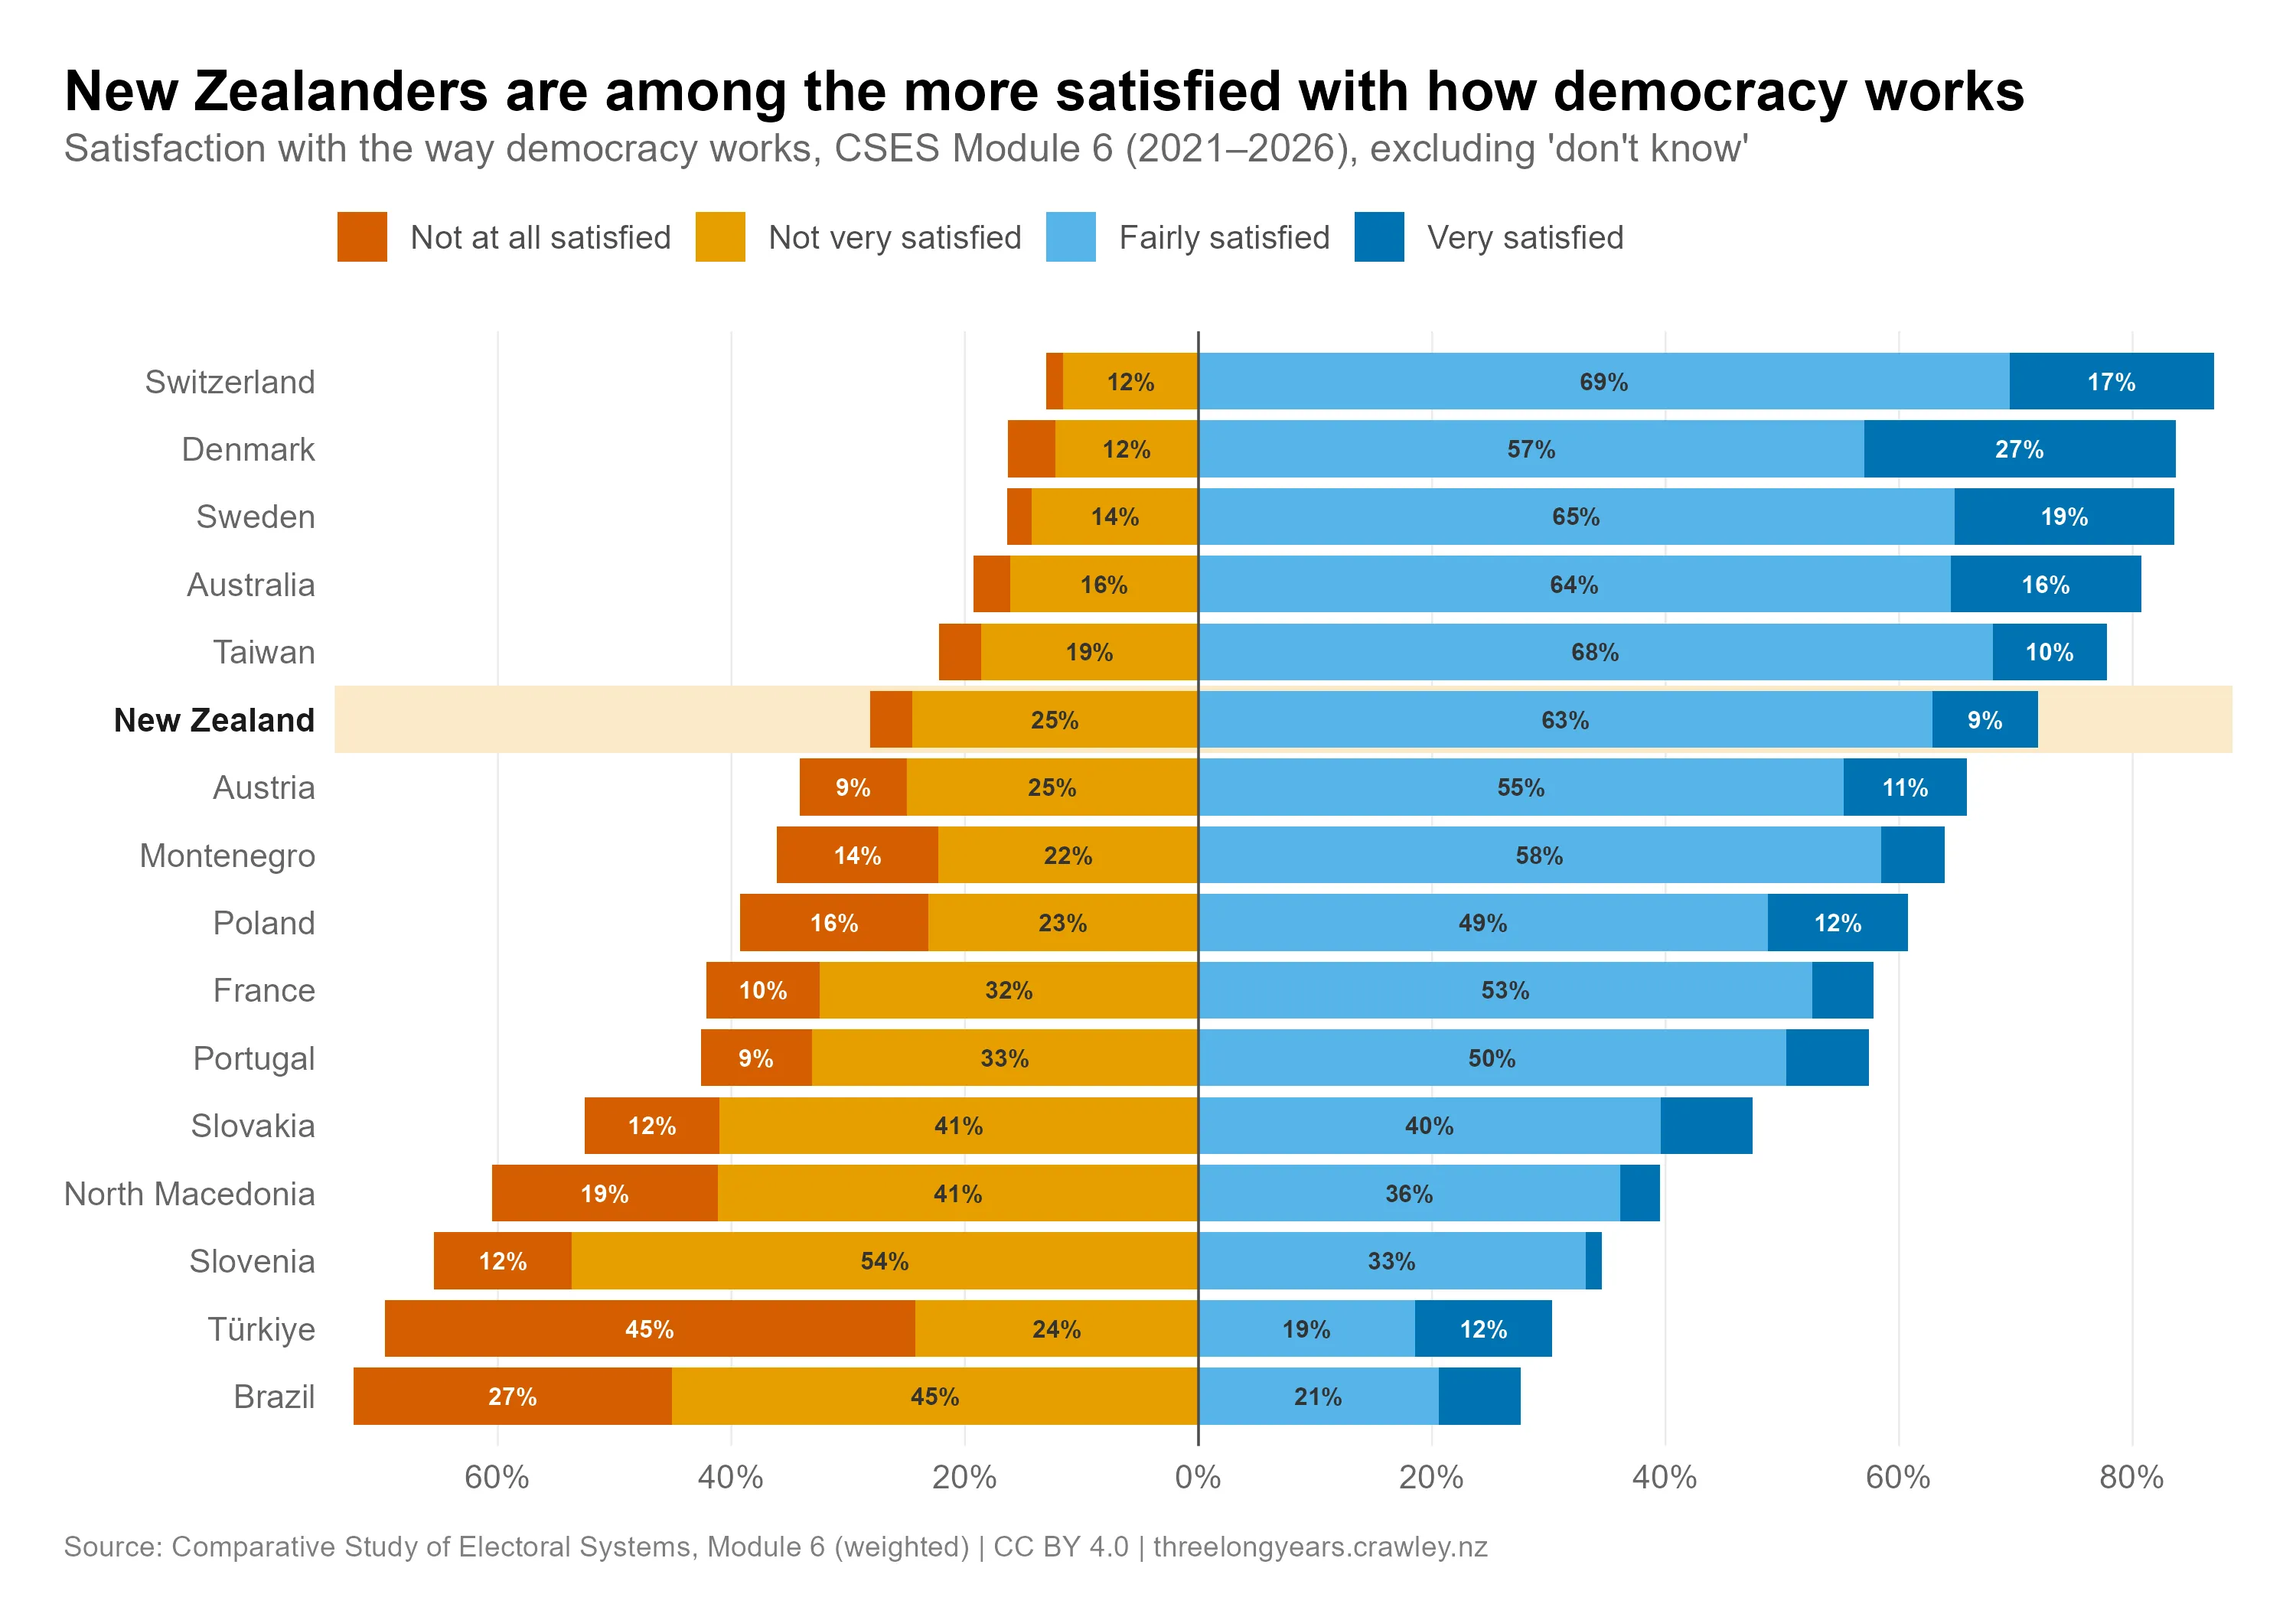
We can also see countries that have faced democratic challenges — such as Slovenia, Türkiye and Brazil — have very low public satisfaction with democracy. That’s at least suggestive that satisfaction tracks the actual state of a country’s democracy.
Who is satisfied — and who isn’t?
While most New Zealanders are broadly satisfied with democracy, not everyone is. Looking at who is more or less satisfied could help make sense of any drop that follows this year’s election.
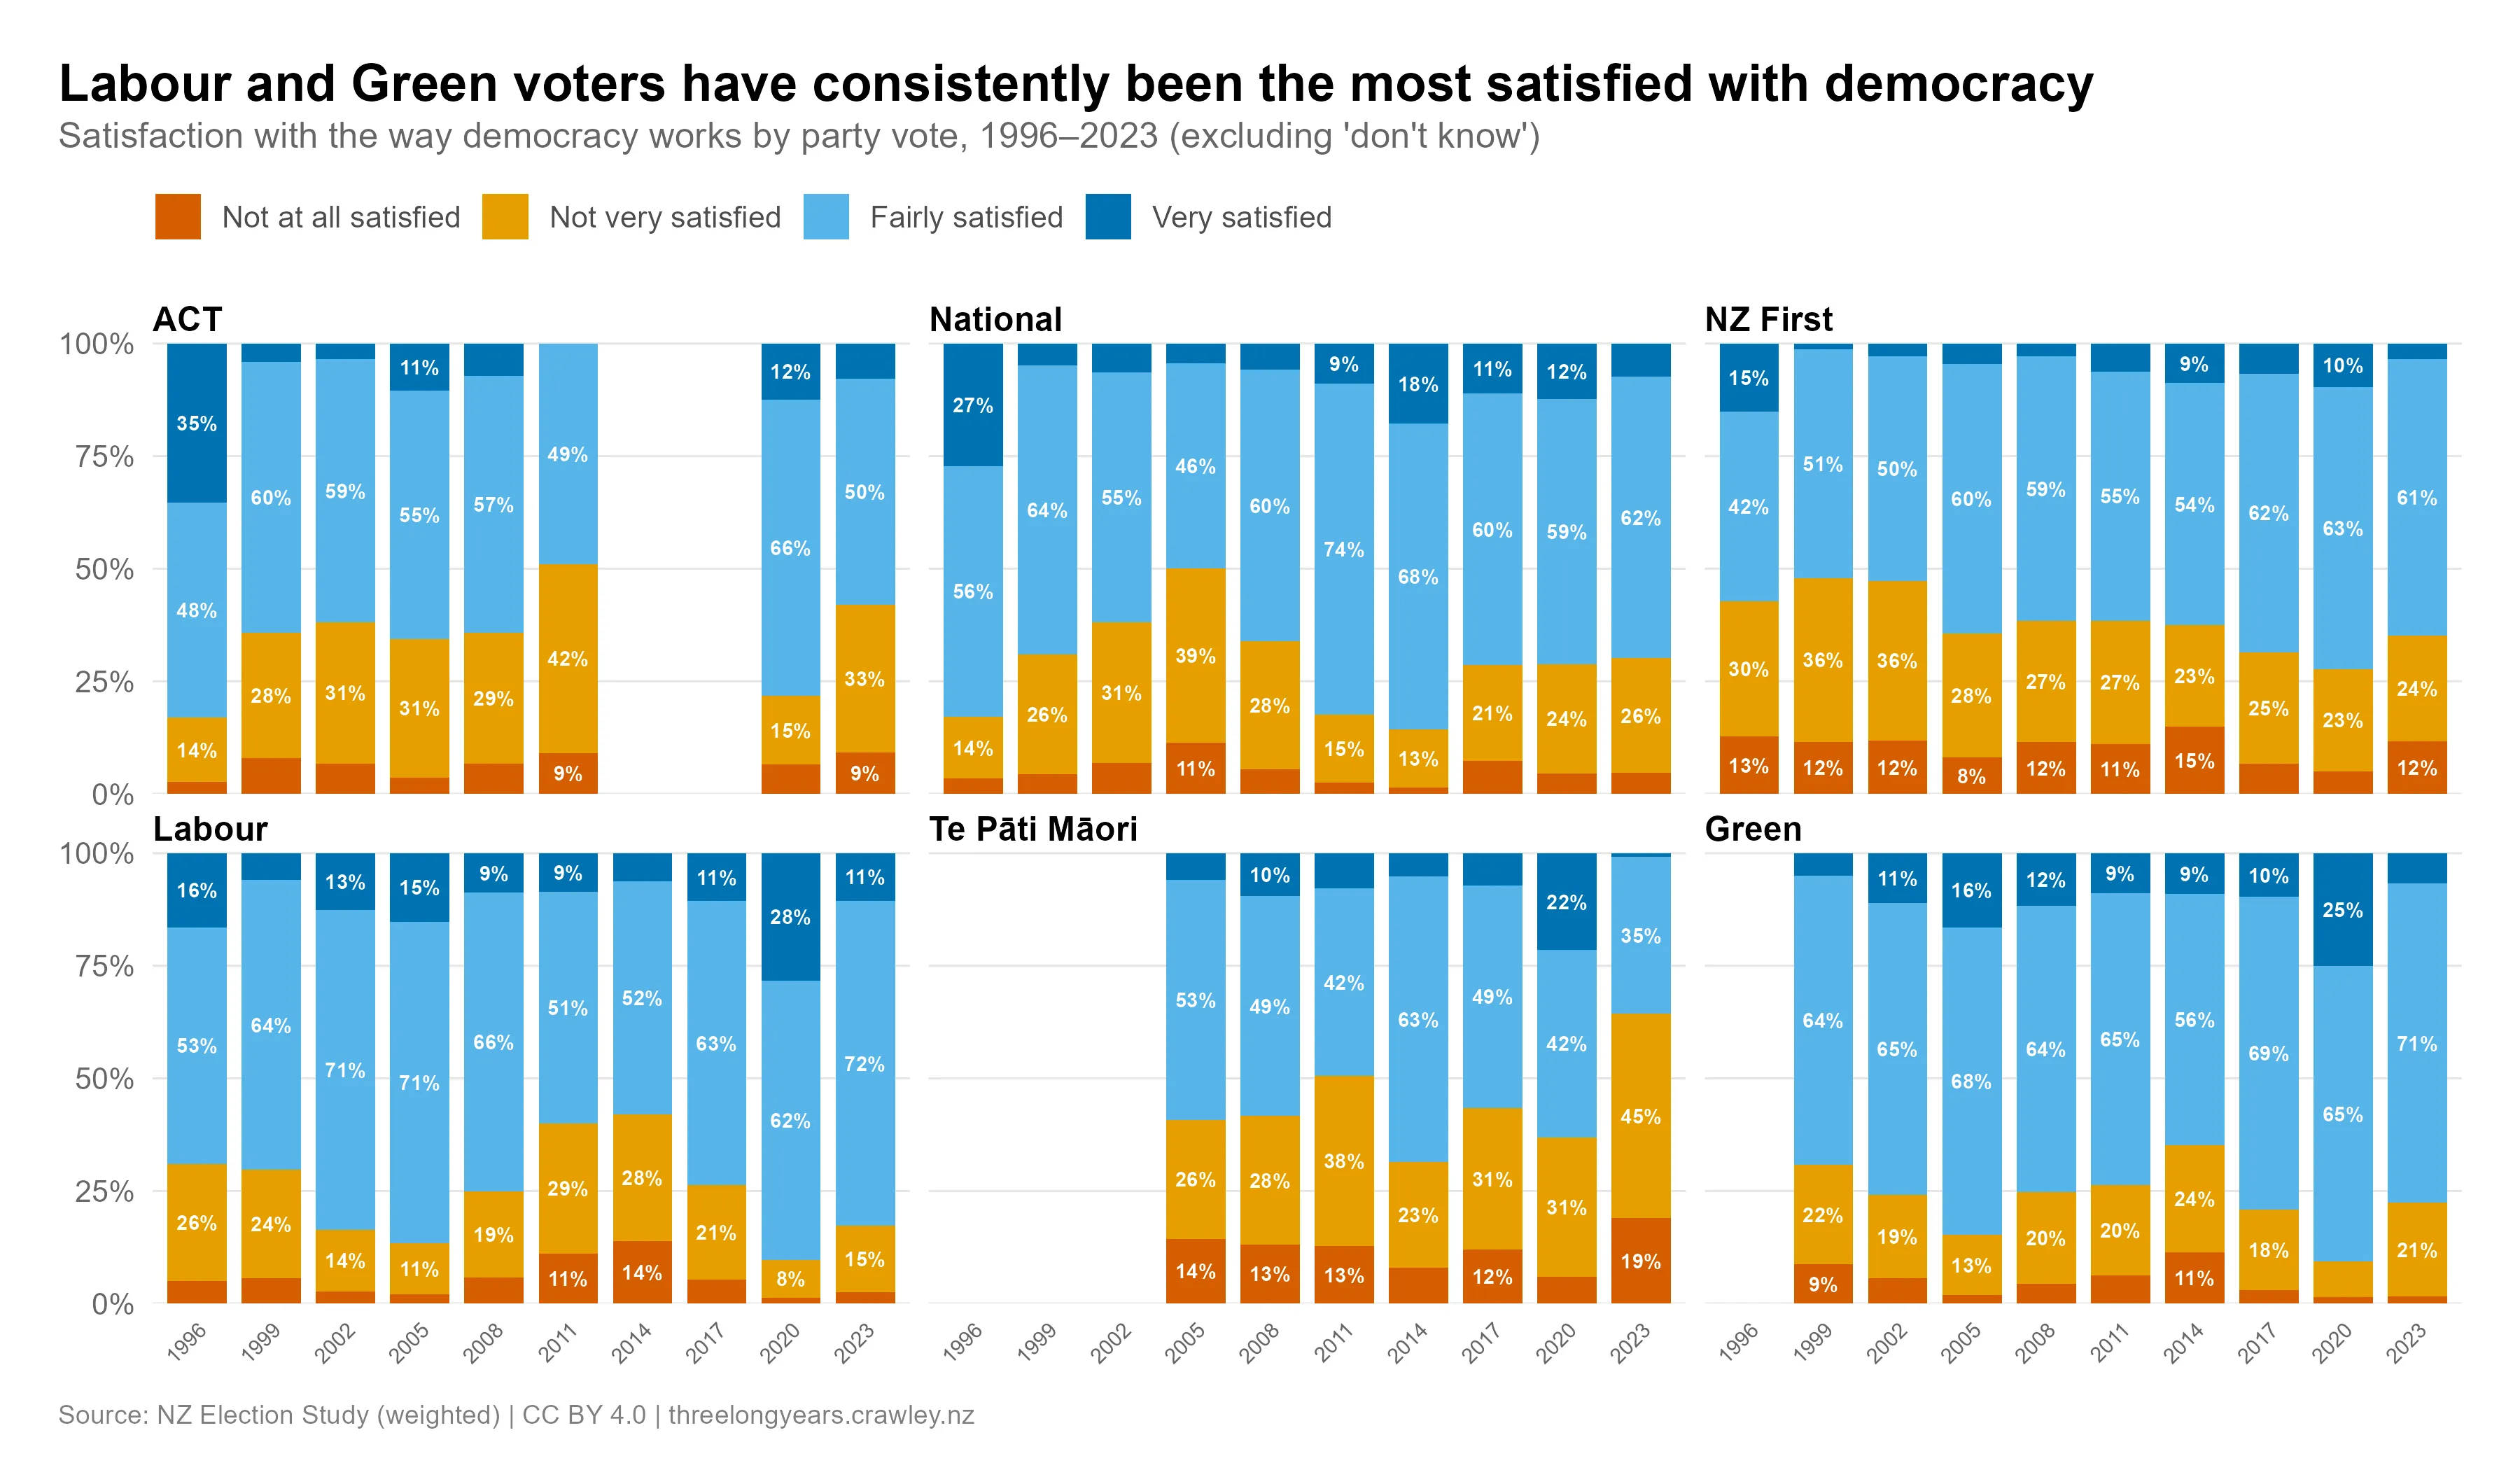
The next figure shows the trends in democratic satisfaction by party support. Satisfaction is high among supporters of all parties, with one exception: Te Pāti Māori supporters in 2023, where it dipped to 36%.
There are also signs that satisfaction relates to election results. The low point for National party supporters was 2005 after Helen Clark won a third term. Labour party supporters were particularly dissatisfied in 2011 and 2014 after big losses to John Key’s National party. This kind of pattern is common in responses to this question, and shows frustration with the system can build when people’s preferred party keeps losing.
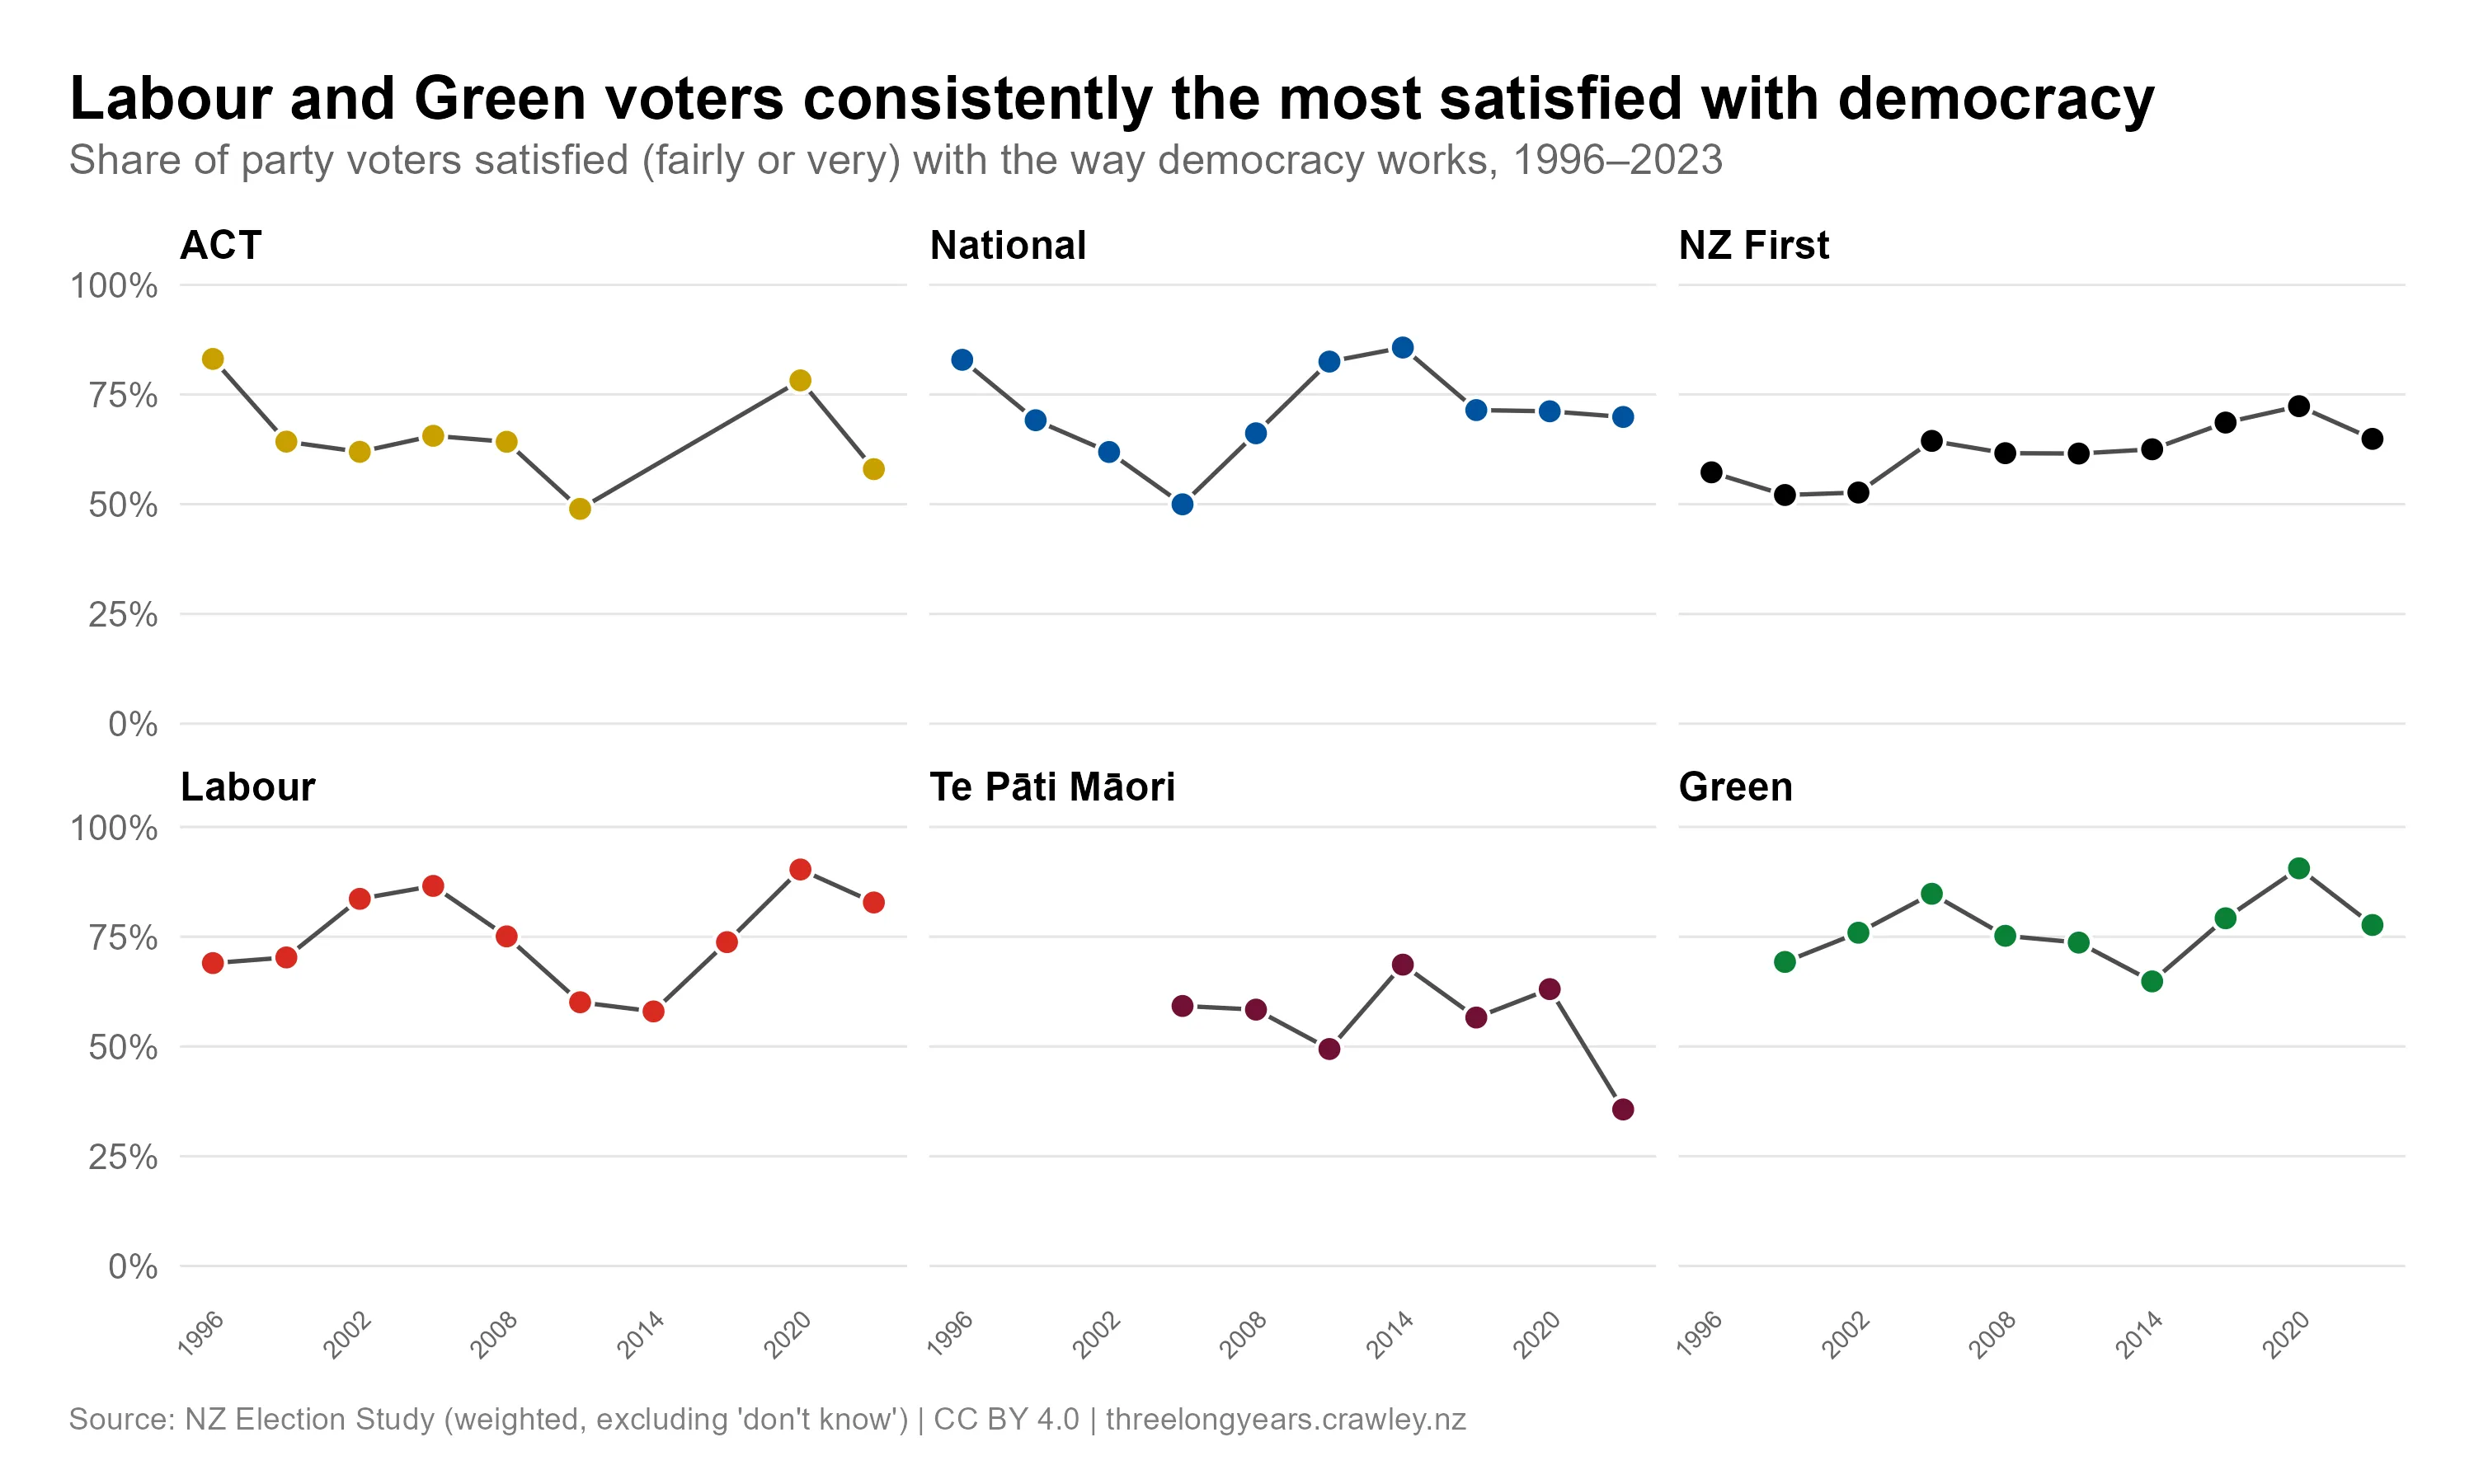
Satisfaction with democracy by party vote, 1996–2023
Another reason people may become dissatisfied with democracy is that they feel the government is not accountable and doesn’t respond to their concerns. The expert analyses mentioned earlier noted a decline in government public consultation since before the 2023 election. To see whether there are any signs the public perceived this change, I split democratic satisfaction by whether people have engaged in political participation recently.
The top panel of the next figure shows that people are roughly equally satisfied with democracy, regardless of whether or not they’ve taken part in a government consultation within the last 5 years. This suggests people are not getting frustrated with the consultation process — or at least weren’t back in 2023.
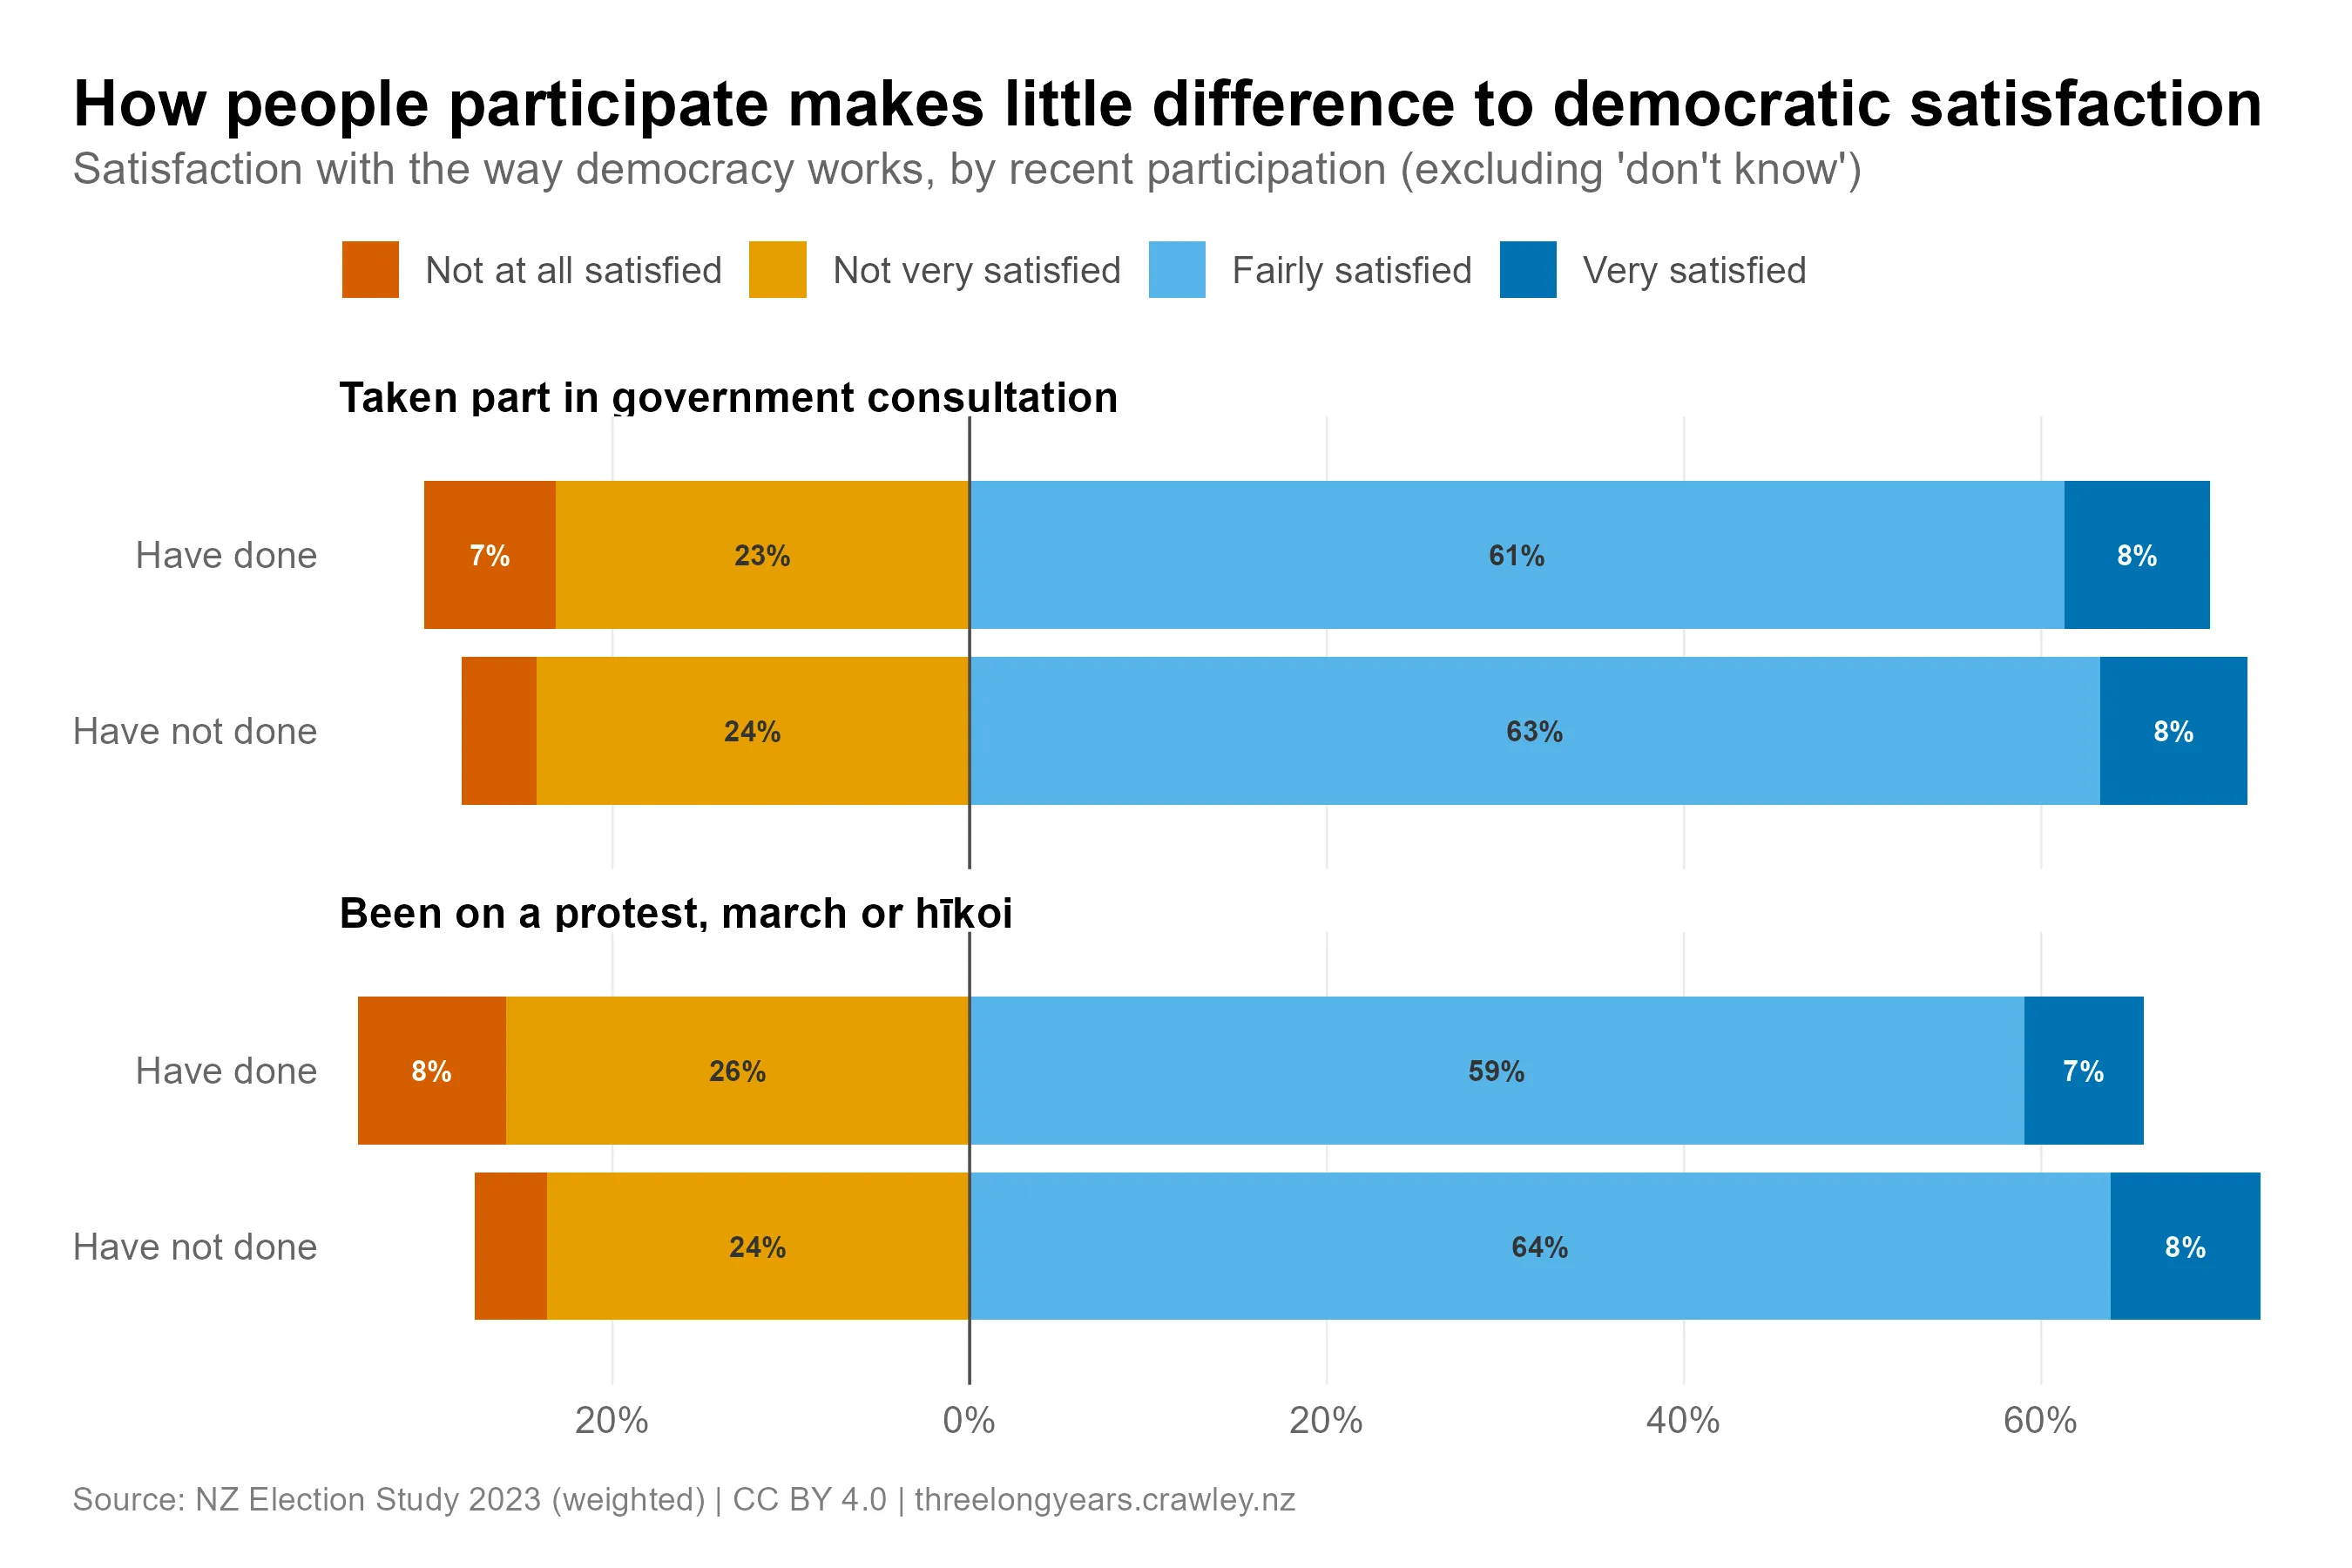
In the lower panel, we can see that people who protest are slightly less satisfied with democracy than people who don’t. It’s a small difference, however, and may simply reflect dissatisfied people being more likely to protest (rather than the other way around). Overall, there does not seem to be a strong link between how people participate and their satisfaction with democracy.
Will Kiwis still be satisfied after 2026?
So New Zealanders are content with their democracy: a majority of voters for almost every party are satisfied, and that satisfaction has held steady for 30 years.
However, I only had access to data up to 2023, and the expert surveys I covered previously indicate the drop in New Zealand’s democratic quality has largely come under the current government. There has been significant criticism of some of the National-ACT-NZ First coalition’s extensive use of urgency to pass legislation, and of removal of same-day enrolments. The 2026 election study will be among the first to test whether the public notices.
When we get data from 2026, the partisan patterns will be especially telling. As we’ve seen, satisfaction with democracy can track whether your side won, so a modest dip among opposition supporters would be unremarkable on its own.
But against three decades of remarkably stable satisfaction, an unusually steep fall — even among opposition supporters alone — would signal something out of the ordinary: a strong reaction to the current government’s practices. We may also see people who vote for the coalition parties becoming less satisfied. Either would suggest the apparent decline in democratic quality is registering with the public, not just ordinary disappointment at the result.
Satisfaction with democracy is also closely tied to a broader question: how much people trust the government, politicians and democratic institutions. There are already signs of growing discontent on that front, and trust will be the subject of a future post.
Until the 2026 data arrives, the question stays open. New Zealanders are content with their democracy today; whether that holds through the current government’s term, we will only learn then.
Footnotes
-
Arguably, the removal of same-day enrolments by the current government gives them an advantage, but it is only a small change relative to the major changes made by (for example) Viktor Orbán when he governed Hungary. ↩
-
The totals for NZ differ slightly from those presented earlier. This difference is because not all NZES responses are included in CSES. ↩
The analysis code for this post is available on Codeberg.
View code on Codeberg →